Fig. 4
Download original image
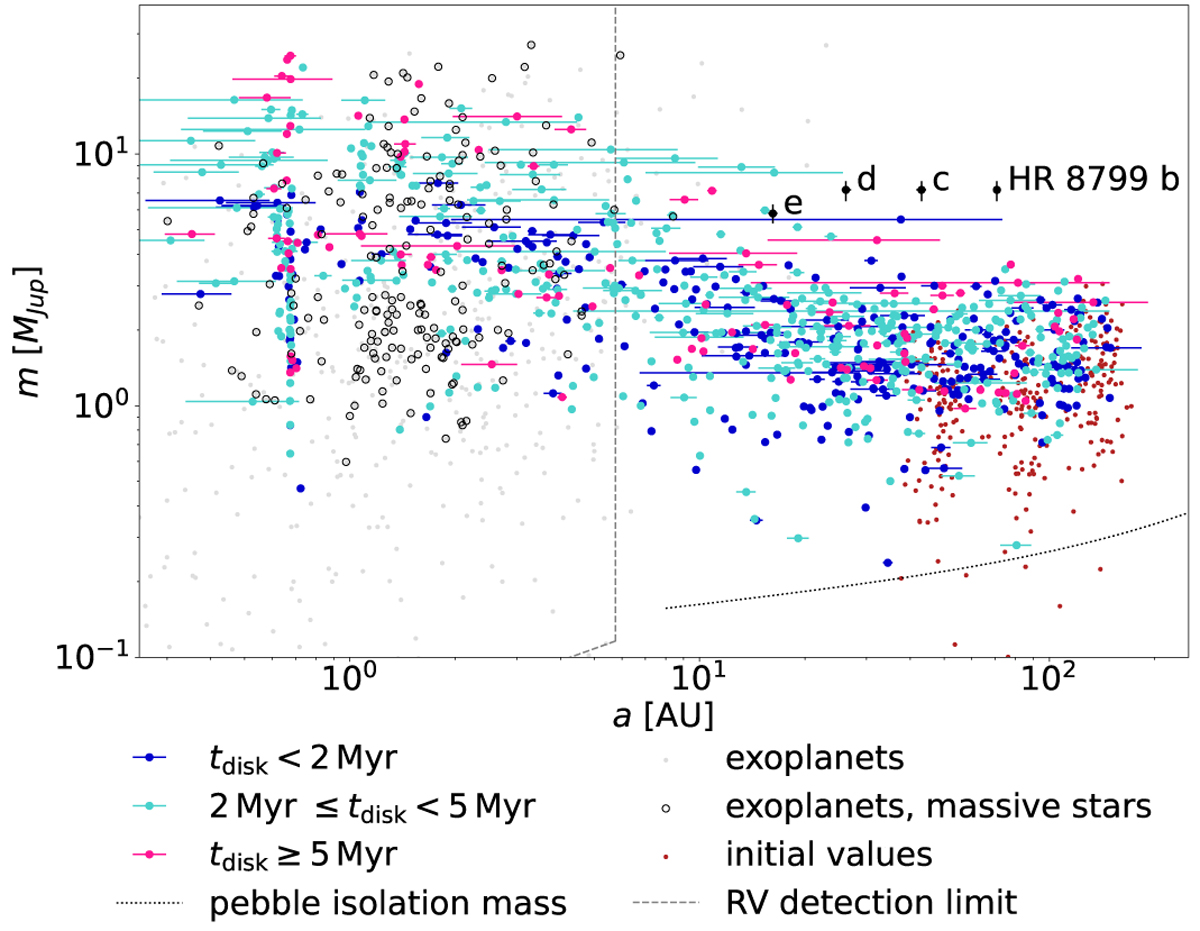
Mass vs. semi-major axis plot comparing all simulated planets to the known exoplanet population. The plot is in all aspects the same as Fig. 3, except that the simulated planets are colored to reflect the gas lifetime tdisk of the disk in which they formed instead of the α viscosity parameter. Simulated planets with tdisk < 2 Myr, tdisk between 2 and 5 Myr, and tdisk ≥ 5 Myr are shown as colored dots in blue, turquoise and pink, respectively. It is apparent that the dependence of the final orbital parameters on the disk lifetime tdisk is small compared to the dependence on the viscosity parameter α (see Fig. 3).
Current usage metrics show cumulative count of Article Views (full-text article views including HTML views, PDF and ePub downloads, according to the available data) and Abstracts Views on Vision4Press platform.
Data correspond to usage on the plateform after 2015. The current usage metrics is available 48-96 hours after online publication and is updated daily on week days.
Initial download of the metrics may take a while.