Fig. 1
Download original image
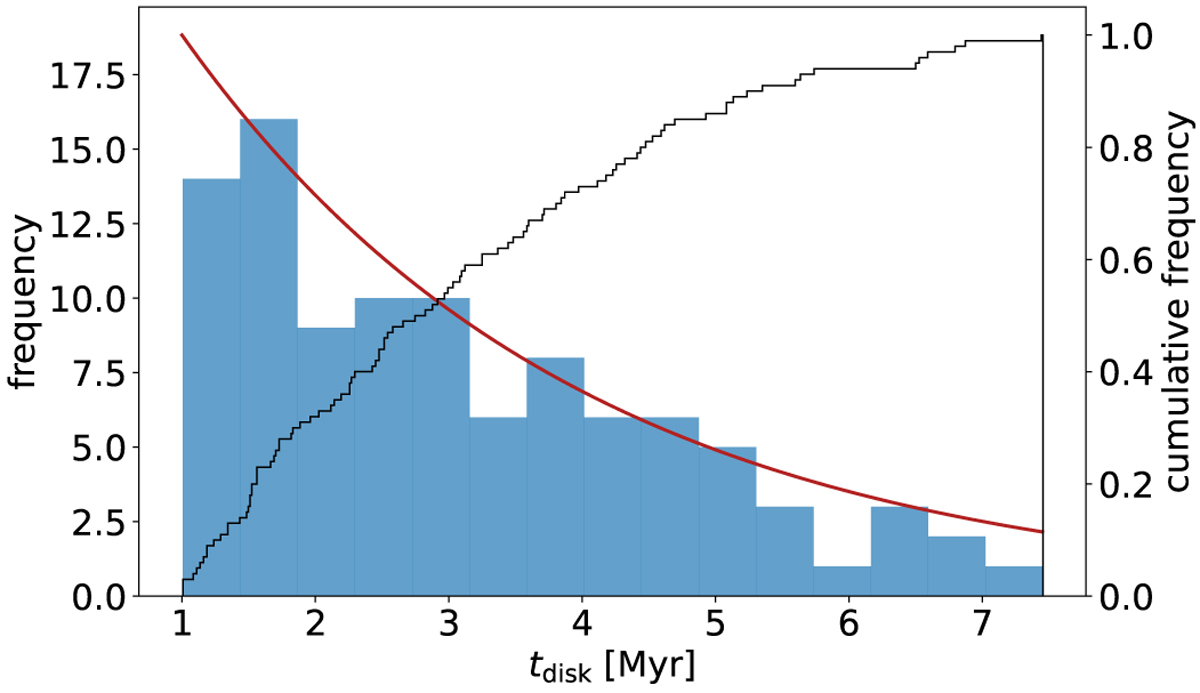
Distribution of gas disk lifetimes tdisk used in the simulations. The 100 samples (blue histogram) drawn randomly from the underlying exponential distribution (red line) are displayed as well as the cumulative frequency (black outline). The distribution is limited to lifetimes between 1 ≤ tdisk ≤ 7.5 Myr additional to the current age of the system of approximately 5 Myr.
Current usage metrics show cumulative count of Article Views (full-text article views including HTML views, PDF and ePub downloads, according to the available data) and Abstracts Views on Vision4Press platform.
Data correspond to usage on the plateform after 2015. The current usage metrics is available 48-96 hours after online publication and is updated daily on week days.
Initial download of the metrics may take a while.