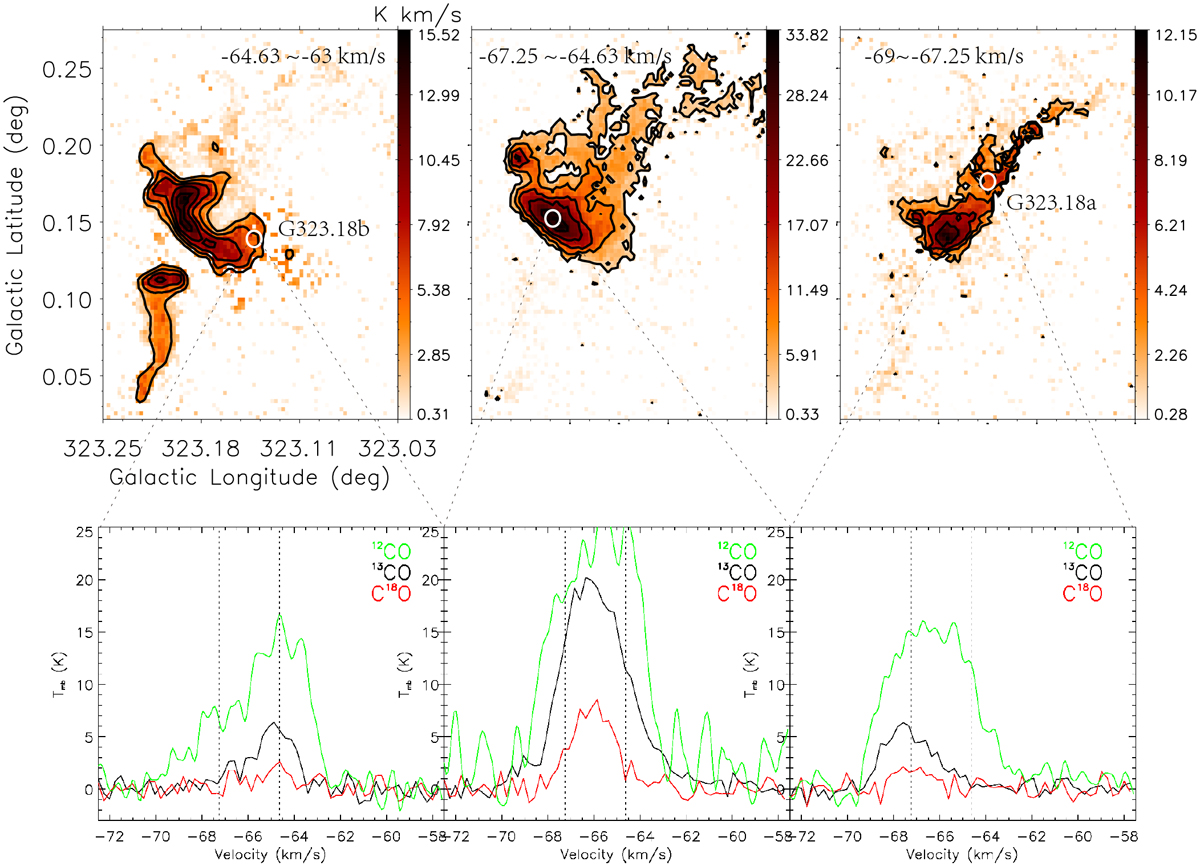
Fig. 7
Download original image
Spectra of the three regions in G323.18+0.15. Upper panels from left to right are the integral intensities corresponding to the velocity ranges from −64.63 to −63 km s−1, from −67.25 to −64.63 km s−1, and from −69 to −67.25 km s−1. The corresponding black contours start at 3Kkm s−1 and increase in steps of 2.2, 6.1, and 1.3Kkms−1, respectively. Lower panels: for the 3 × 12CO(J = 1−0), 1.5 × 13CO(J = 2−1), and 1.5 × C18O(J = 2−1) spectra extracted at three different positions of the G323.18+0.15 complex, indicated by white circles in the corresponding upper panels. The vertical dashed black lines represent the systemic velocities of G323.18a (−67.25 km s−1) and G323018b (−64.63 km s−1).
Current usage metrics show cumulative count of Article Views (full-text article views including HTML views, PDF and ePub downloads, according to the available data) and Abstracts Views on Vision4Press platform.
Data correspond to usage on the plateform after 2015. The current usage metrics is available 48-96 hours after online publication and is updated daily on week days.
Initial download of the metrics may take a while.