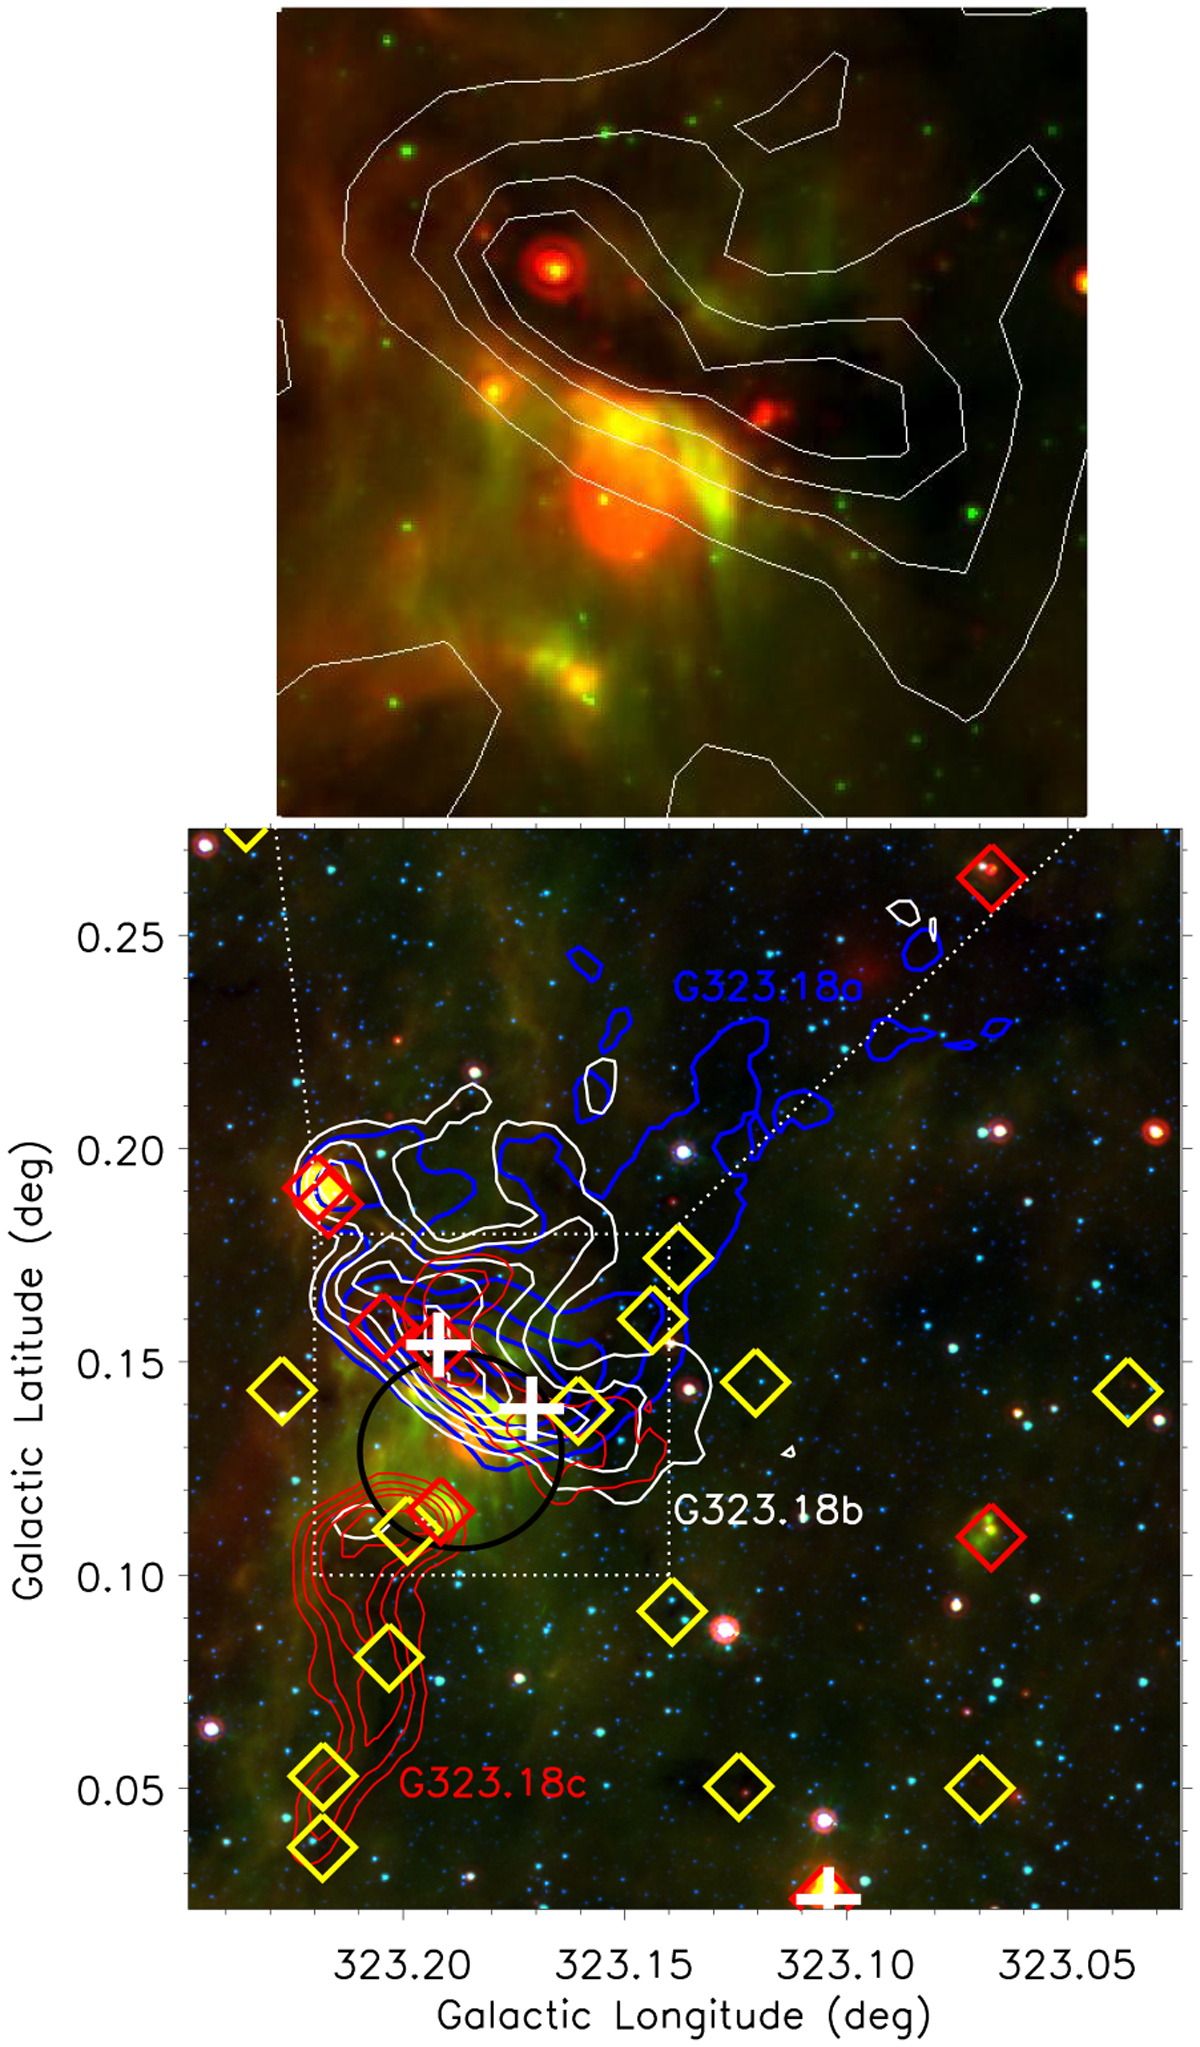
Fig. 6
Download original image
Velocity-integrated intensity maps of the 13CO (J =2−1) emission. Bottom panel: Velocity-integrated intensity map of G323.18a (blue contours integrated from −69.0 to −65.5 km s−1 starting at 2 K km s−1 with an increment of 5.5 K km s−1), G323.18b (white contours, integrated from −65.5 to 64.0kms−1 starting a 2 K km s−1 with an increment of 3.8 Kkm s−1), and G323.18c (red contours, integrated from −64 to −62 km s−1 starting at 2 K km s−1 with an increment of 2.3 K kms−1). The black circle denotes HII region G323.187+00.129 identified by Anderson et al. (2014). The yellow and red diamonds are prestellar and protostellar clumps from the Herschel Hi-Gal clump catalog, and the white crosses are ATLASGAL 870 µm clumps. The background is a three-color map with red, green, and blue for 24, 8, and 4.5 µm, respectively. Top panel: white contours start from 2 × 1021 cm−2 and increase in steps of 1.9 × 1021 cm−2. They display the distribution of the H2 column density of the dotted rectangle in the bottom panel. The background is the same as in the bottom panel.
Current usage metrics show cumulative count of Article Views (full-text article views including HTML views, PDF and ePub downloads, according to the available data) and Abstracts Views on Vision4Press platform.
Data correspond to usage on the plateform after 2015. The current usage metrics is available 48-96 hours after online publication and is updated daily on week days.
Initial download of the metrics may take a while.