Fig. 5

Download original image
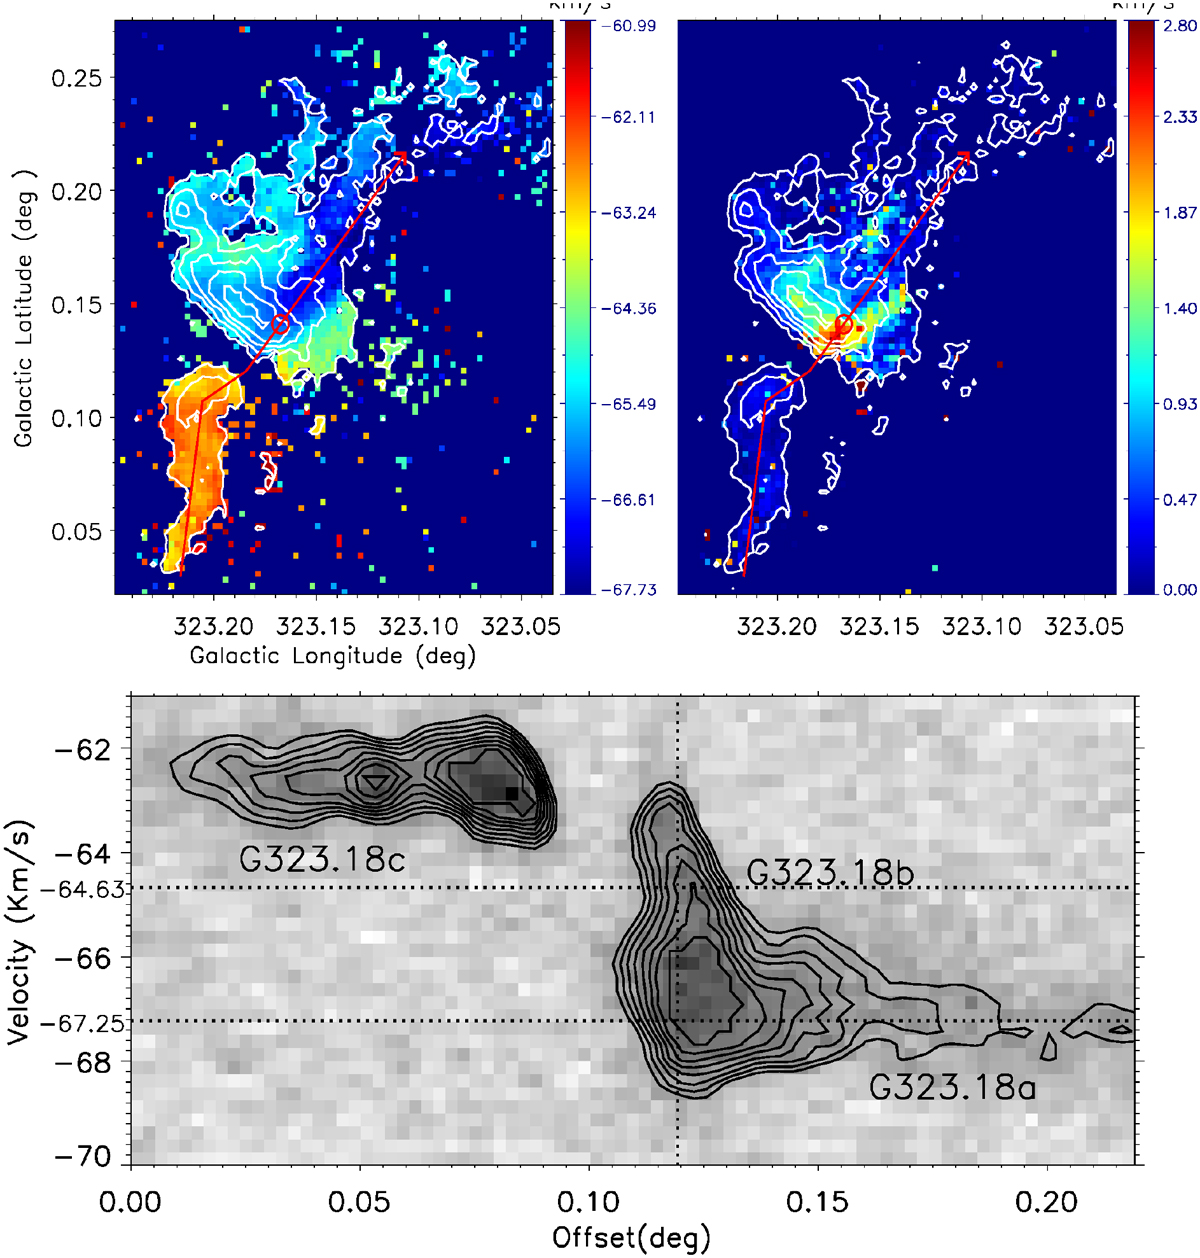
Moment 1 and Moment 2 of the G323.18+0.15 complex, and PV diagram along its filamentary structure. Top: color backgrounds in the left and right panels are velocity field and velocity dispersion of 13CO (J = 2−1). The white contours denote 13CO emission integrated from −69 to −61 km s−1, which starts from 2 Kkm s−1 (signal weaker than 3σ is masked out) and increases in steps of 9 Kkm s−1. Bottom: position-velocity diagram of the 13CO(J = 2−1) emission along the direction labeled by the red line in the top panel. The vertical dotted black line represents the position that is plotted as small red circles in the top panel. The horizontal dotted black lines represent the system velocities of G323.18a and G323.18b. The black contours start at 3 K and increase in steps of 0.9 K.
Current usage metrics show cumulative count of Article Views (full-text article views including HTML views, PDF and ePub downloads, according to the available data) and Abstracts Views on Vision4Press platform.
Data correspond to usage on the plateform after 2015. The current usage metrics is available 48-96 hours after online publication and is updated daily on week days.
Initial download of the metrics may take a while.


