Fig. 3
Download original image
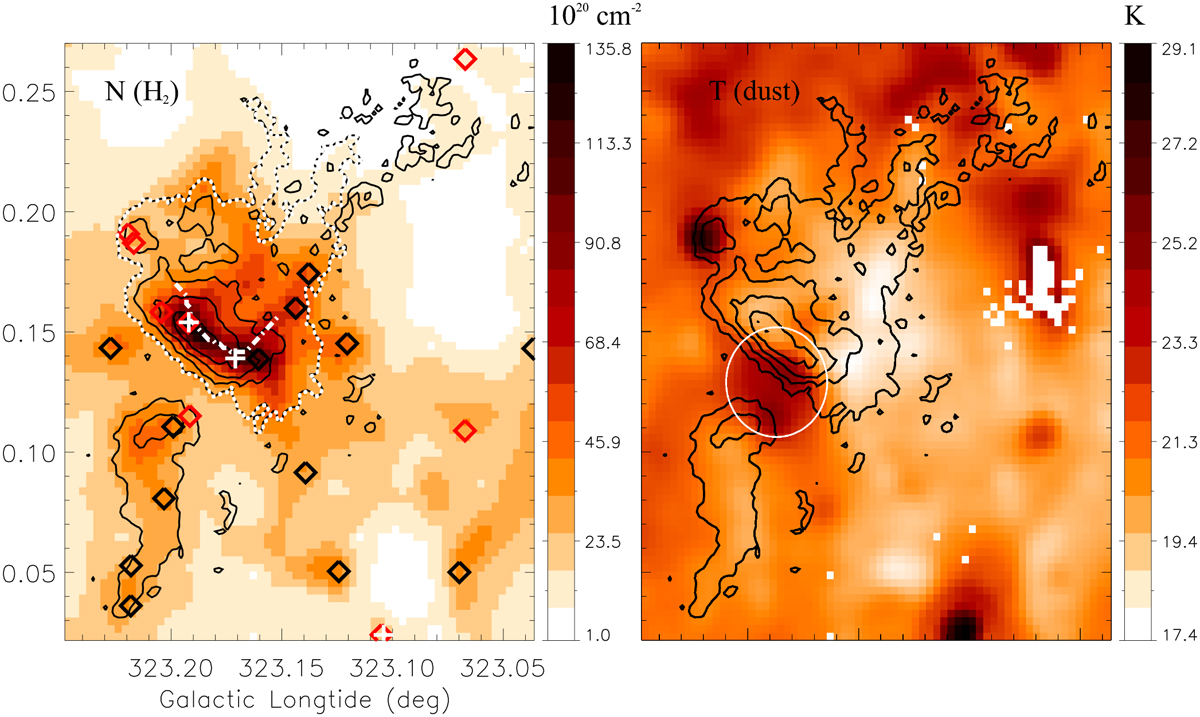
Column density (left) and temperature (right) distributions within the G323.18+0.15 complex. The black contours indicate the 13CO (J = 2−1) integrated intensity in areas where Tmb is higher than 3σ (3 K), The contour levels start from 2 Kkm s−1 and increase in steps of 11 K km s−1. The velocity interval of the integration is −69 to −61 kms−1. The region surrounded by the dotted white line is used for the calculations in Sect. 4.1. The dot-dashed white line is the skeleton of filament G323.179+0.149 identified by Li et al. (2016). The black and red diamonds are prestellar and protostellar clumps from the Herschel HIGAL clump catalog, and the white crosses are ATLASGAL 870 µm clumps (see Table 1 for details). The white circle in the right panel is the HII region G323.187+00.129 identified by Anderson et al. (2014).
Current usage metrics show cumulative count of Article Views (full-text article views including HTML views, PDF and ePub downloads, according to the available data) and Abstracts Views on Vision4Press platform.
Data correspond to usage on the plateform after 2015. The current usage metrics is available 48-96 hours after online publication and is updated daily on week days.
Initial download of the metrics may take a while.