Fig. 2
Download original image
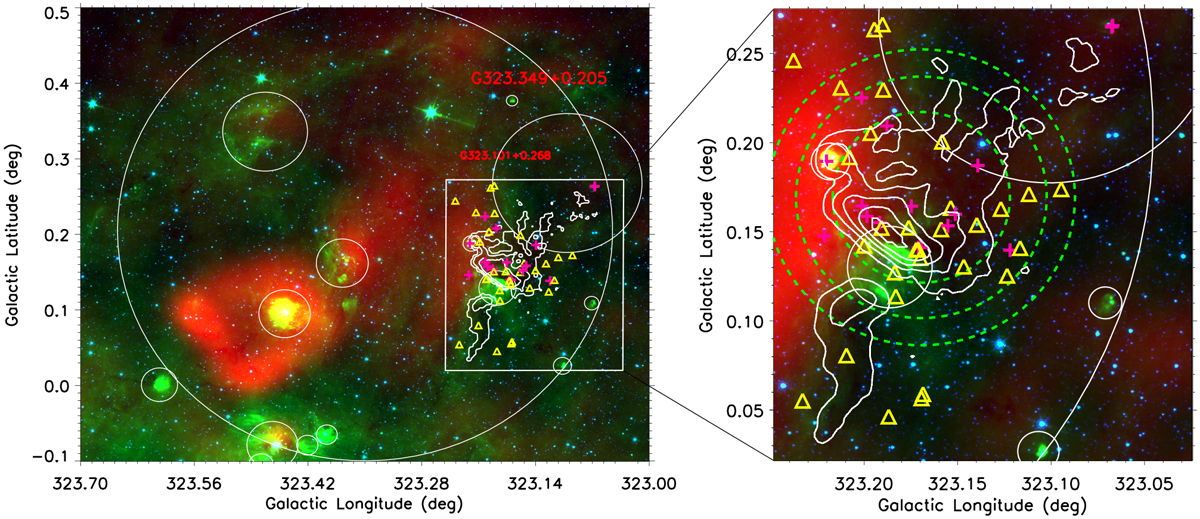
Three-color map of the G323.18+0.15 complex (right) and nearby HII regions (left). Left: red, green, and blue background shows 21 cm, 8 µm, and 4.5 µm emission, respectively. The white circles are the HII regions identified by Anderson et al. (2014). The white rectangular box is the research region, a zoom of which is shown in the right panel. The white contours are the integral intensity of the 13CO emission from −69 to −61 km s−1 in the G323.18+0.15 complex. The white crosses and yellow triangles are class I and II YSOs, respectively. Right: same as the left panel, but the dashed green circles are the area for which the surface density was calculated (see Sect. 4.2).
Current usage metrics show cumulative count of Article Views (full-text article views including HTML views, PDF and ePub downloads, according to the available data) and Abstracts Views on Vision4Press platform.
Data correspond to usage on the plateform after 2015. The current usage metrics is available 48-96 hours after online publication and is updated daily on week days.
Initial download of the metrics may take a while.