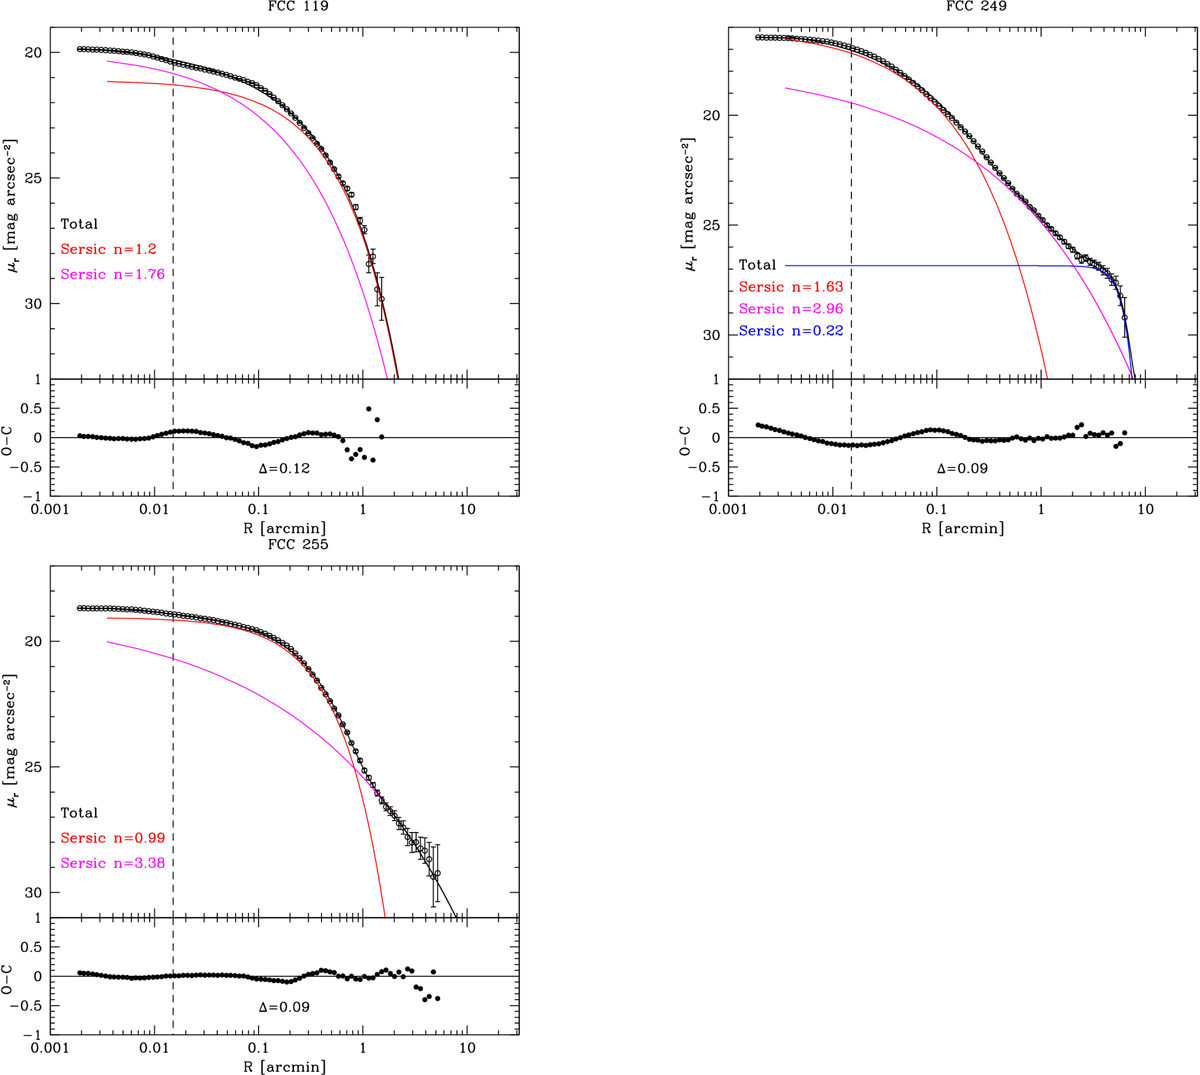
Fig. A.1.
Download original image
Deconvolved and azimuthally averaged radial profiles (open circles) from FDS r-band images of FCC 119 (upper left panels), FCC 249 (upper right panels), and FCC 255 (lower left panels). The red, magenta, and blue lines in the top panels correspond to the best-fitting first, second, and third component, respectively, while the black line shows their total surface brightness. The vertical dashed line marks the size of the galaxy core. The difference between the observed and modelled surface brightness as a function of radius is given in the bottom panels (filled circles) together with the standard deviation of the best fit (Δ, see Spavone et al. (2017) for details).
Current usage metrics show cumulative count of Article Views (full-text article views including HTML views, PDF and ePub downloads, according to the available data) and Abstracts Views on Vision4Press platform.
Data correspond to usage on the plateform after 2015. The current usage metrics is available 48-96 hours after online publication and is updated daily on week days.
Initial download of the metrics may take a while.