Fig. 5.
Download original image
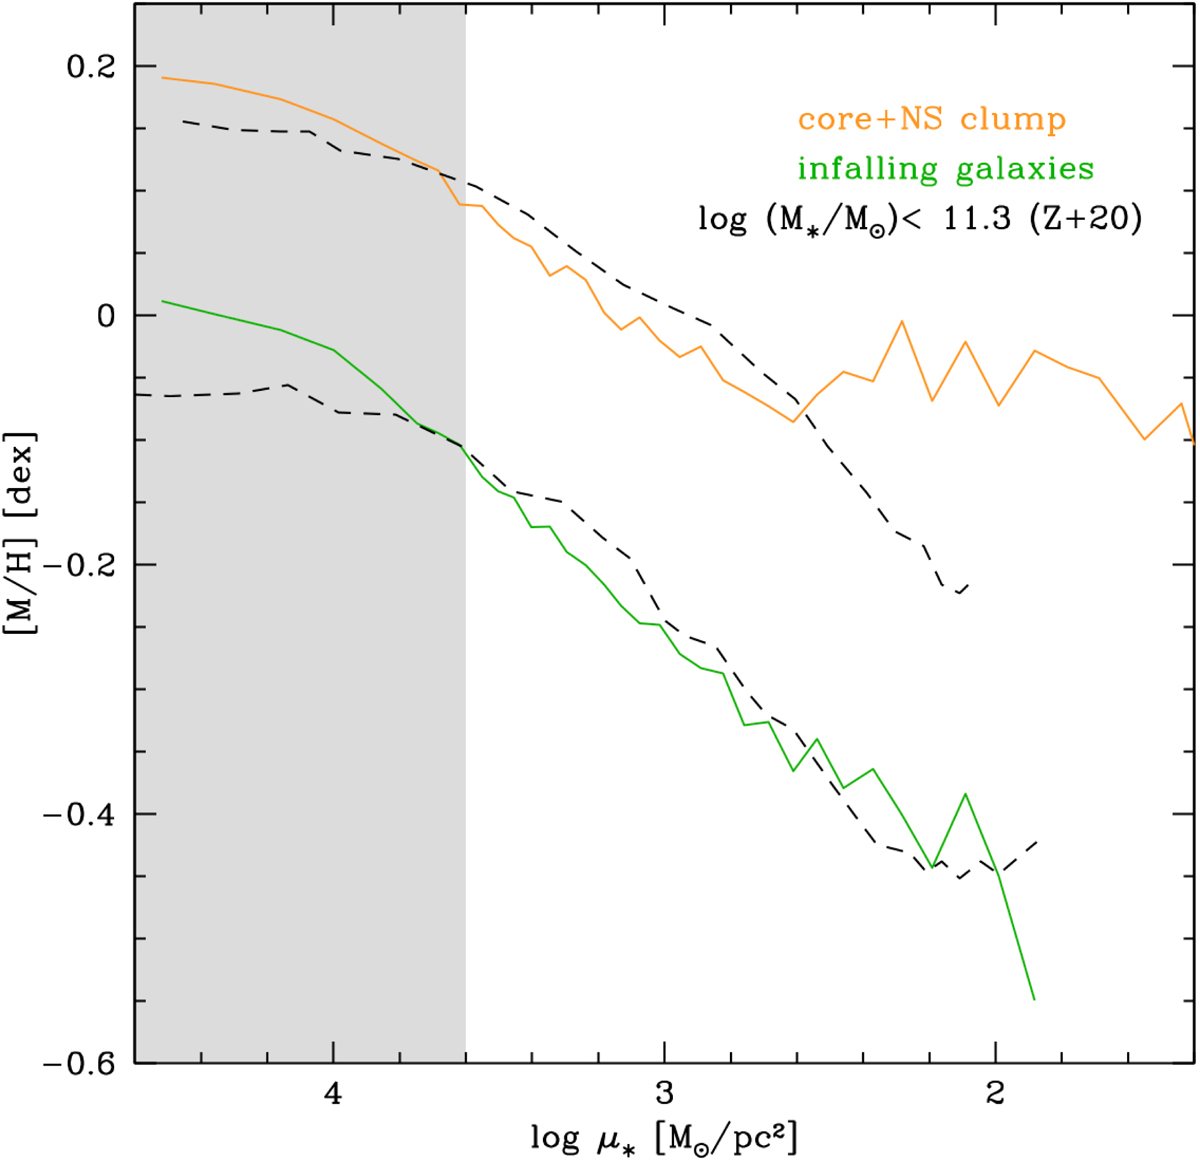
Running mean as a function of stellar mass surface density of the average metallicity profiles for the sample galaxies in the core-NS clump (orange symbols) and for those infalling in the Fornax cluster (green symbols). The black dashed lines correspond to the CALIFA ETGs with log(M*/M⊙)< 11.3 studied by Zibetti et al. (2020). The grey shaded region marks the radial range where the difference of spatial resolution between the CALIFA and MUSE observations affect the profiles.
Current usage metrics show cumulative count of Article Views (full-text article views including HTML views, PDF and ePub downloads, according to the available data) and Abstracts Views on Vision4Press platform.
Data correspond to usage on the plateform after 2015. The current usage metrics is available 48-96 hours after online publication and is updated daily on week days.
Initial download of the metrics may take a while.