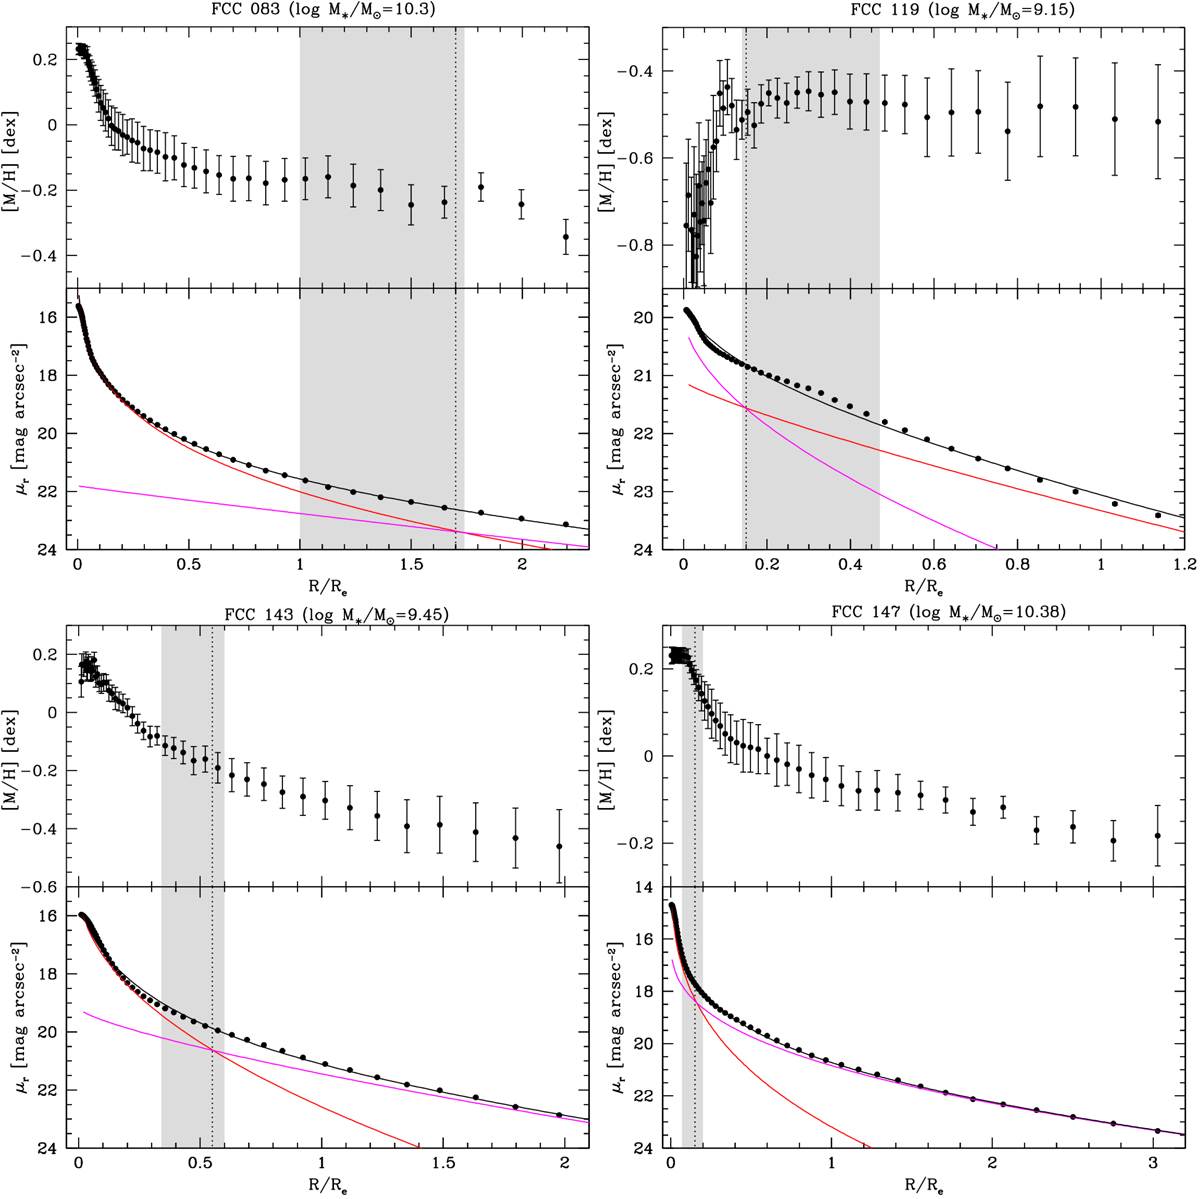
Fig. 1.
Download original image
Azimuthally averaged radial profiles of metallicity (upper panels) and surface brightness (lower panels) of the sample galaxies. Surface-brightness error bars are smaller than symbols. The surface brightness level at which sky subtraction uncertainties become dominant is μr ≥ 26 mag arcsec−2 for all the galaxies. The vertical dotted and dashed lines correspond to the transition radii Rtr, 1 and Rtr, 2, respectively, while the grey shaded areas mark the transition regions between different components of the fit. The red and magenta lines indicate the fit to the central and intermediate regions with a Sérsic profile, while the blue line indicates the fit to the outermost regions. The black line indicates the sum of the best-fitting components. The total stellar mass of each galaxy is given.
Current usage metrics show cumulative count of Article Views (full-text article views including HTML views, PDF and ePub downloads, according to the available data) and Abstracts Views on Vision4Press platform.
Data correspond to usage on the plateform after 2015. The current usage metrics is available 48-96 hours after online publication and is updated daily on week days.
Initial download of the metrics may take a while.