Open Access
Fig. 8.
Download original image
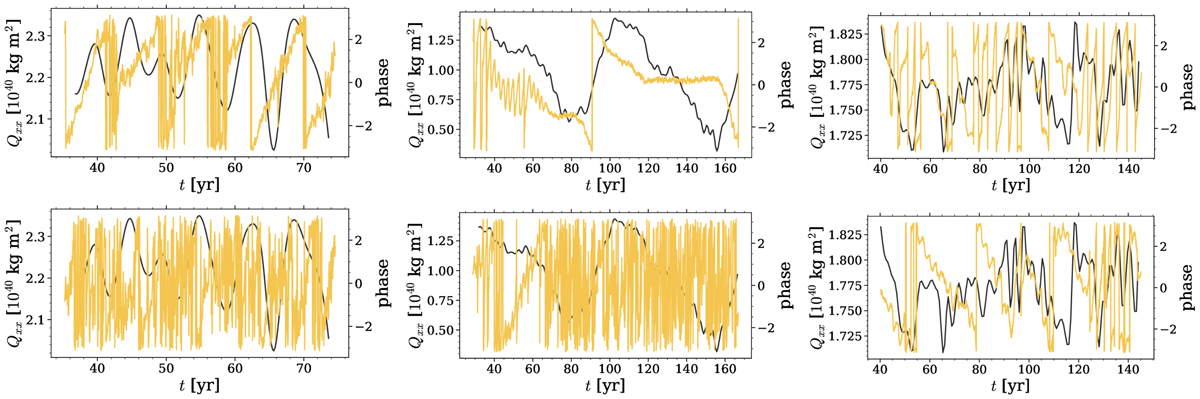
Time evolution of the phase of the m = 1 (top row) and m = 2 modes (bottom row) of radial magnetic field at ϕ = 180° for Run A (left panels), Run B (middle panels), and Run C (right panels) in yellow. The black line corresponds to Qxx.
Current usage metrics show cumulative count of Article Views (full-text article views including HTML views, PDF and ePub downloads, according to the available data) and Abstracts Views on Vision4Press platform.
Data correspond to usage on the plateform after 2015. The current usage metrics is available 48-96 hours after online publication and is updated daily on week days.
Initial download of the metrics may take a while.