Fig. 6.
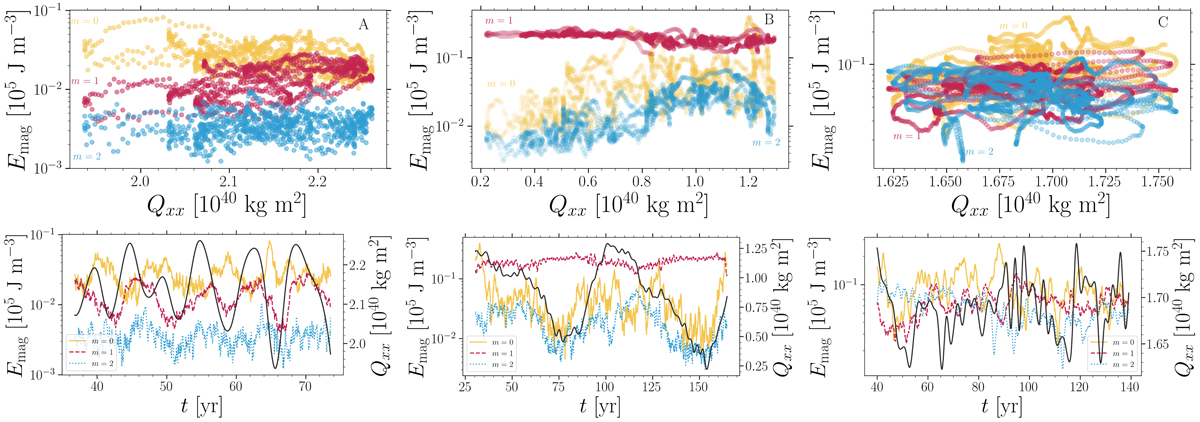
Download original image
Quadrupole moment, density, and moments of inertia. Top row: scatter plot of the magnetic field energy and the quadrupole moment. Bottom row: time evolution of the gravitational quadrupole moment (black line) together with the magnetic energy contained in the axisymmetric mode (m = 0, yellow), as well as the first (m = 1, red) and second (m = 2, blue) non-axisymmetric modes. Run A, Run B, and Run C are shown in the left, middle, and right columns respectively.
Current usage metrics show cumulative count of Article Views (full-text article views including HTML views, PDF and ePub downloads, according to the available data) and Abstracts Views on Vision4Press platform.
Data correspond to usage on the plateform after 2015. The current usage metrics is available 48-96 hours after online publication and is updated daily on week days.
Initial download of the metrics may take a while.