Fig. 9
Download original image
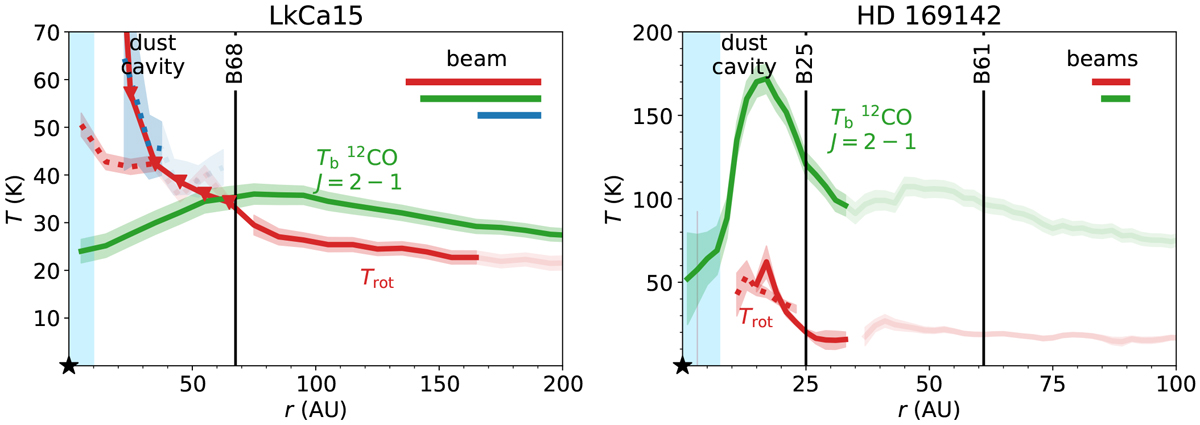
Temperature derived from the line ratio analysis. The rotational temperature (red) is derived from the 13CO J = 6−5 to J = 2−1 line ratio, including optical depth constraints (solid lines), for LkCal5 (left) and HD 169142 (right). The dotted lines in corresponding colors indicate the rotational temperature inside the dust cavity if the emission were optically thin. For comparison, the brightness temperature of the optically thick 12CO J = 2−1 transition (green) is shown. We note the difference in the vertical temperature axes. In the case of LkCal5, the dotted blue line shows the rotational temperature assuming optically thin emission for the (combined) high resolution observations. The downward triangles indicate the upper limit on the rotational temperature due to the upper limit on the integrated C18O J = 2−1 intensity in the dust cavity. The intensity outside the MRS of the observations is shown in a lighter shade of the corresponding colors.
Current usage metrics show cumulative count of Article Views (full-text article views including HTML views, PDF and ePub downloads, according to the available data) and Abstracts Views on Vision4Press platform.
Data correspond to usage on the plateform after 2015. The current usage metrics is available 48-96 hours after online publication and is updated daily on week days.
Initial download of the metrics may take a while.