Fig. 4
Download original image
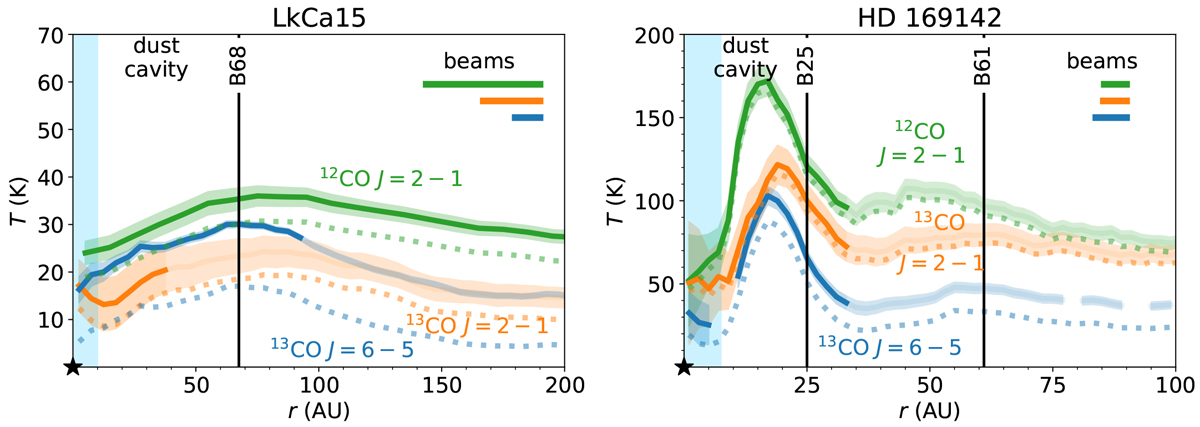
Deprojected azimuthally averaged radial proflies of brightness temperatures of the 12CO J = 2−1 (green), 13CO J=2−1 (orange), and 13CO J = 6−5 (blue) transition for LkCal5 (left) and HD 169142 (right). The solid lines show the brightness temperature calculated using the Planck function, and the faded dotted colors show the Rayleigh-Jeans approximation. The vertical black lines indicate the rings seen in the Band 9 continuum, and the light blue region starting from 0 AU indicates the gas cavity. The MRS of the HD 169142 J = 6−5 data corresponds to a radius of 35 AU.
Current usage metrics show cumulative count of Article Views (full-text article views including HTML views, PDF and ePub downloads, according to the available data) and Abstracts Views on Vision4Press platform.
Data correspond to usage on the plateform after 2015. The current usage metrics is available 48-96 hours after online publication and is updated daily on week days.
Initial download of the metrics may take a while.