Fig. C.3
Download original image
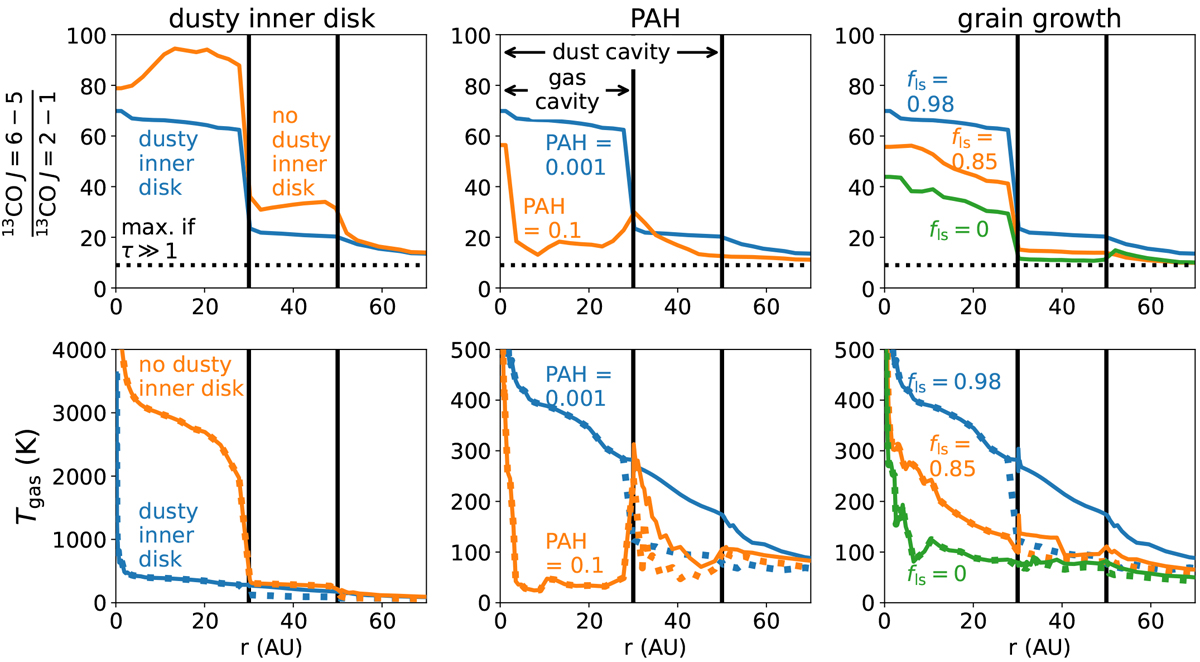
Modeled line ratio for the Herbig disk model (top), where the absence of a dusty inner disk (left), the PAH abundance with respect to the ISM (middle), and the fraction of large grains (right) are compared to the fiducial Herbig disk model with a 0.01 times drop in gas density inside 30 AU (blue). The bottom row shows the temperature at the τ = 1 surface for the 13CO J = 6−5 (solid) and J = 2−1 (dotted) transitions. Both 13CO lines are (moderately) optically thin inside the gas cavities of these models. Therefore, the midplane temperature is shown in this region. We note the difference in the temperature axes.
Current usage metrics show cumulative count of Article Views (full-text article views including HTML views, PDF and ePub downloads, according to the available data) and Abstracts Views on Vision4Press platform.
Data correspond to usage on the plateform after 2015. The current usage metrics is available 48-96 hours after online publication and is updated daily on week days.
Initial download of the metrics may take a while.