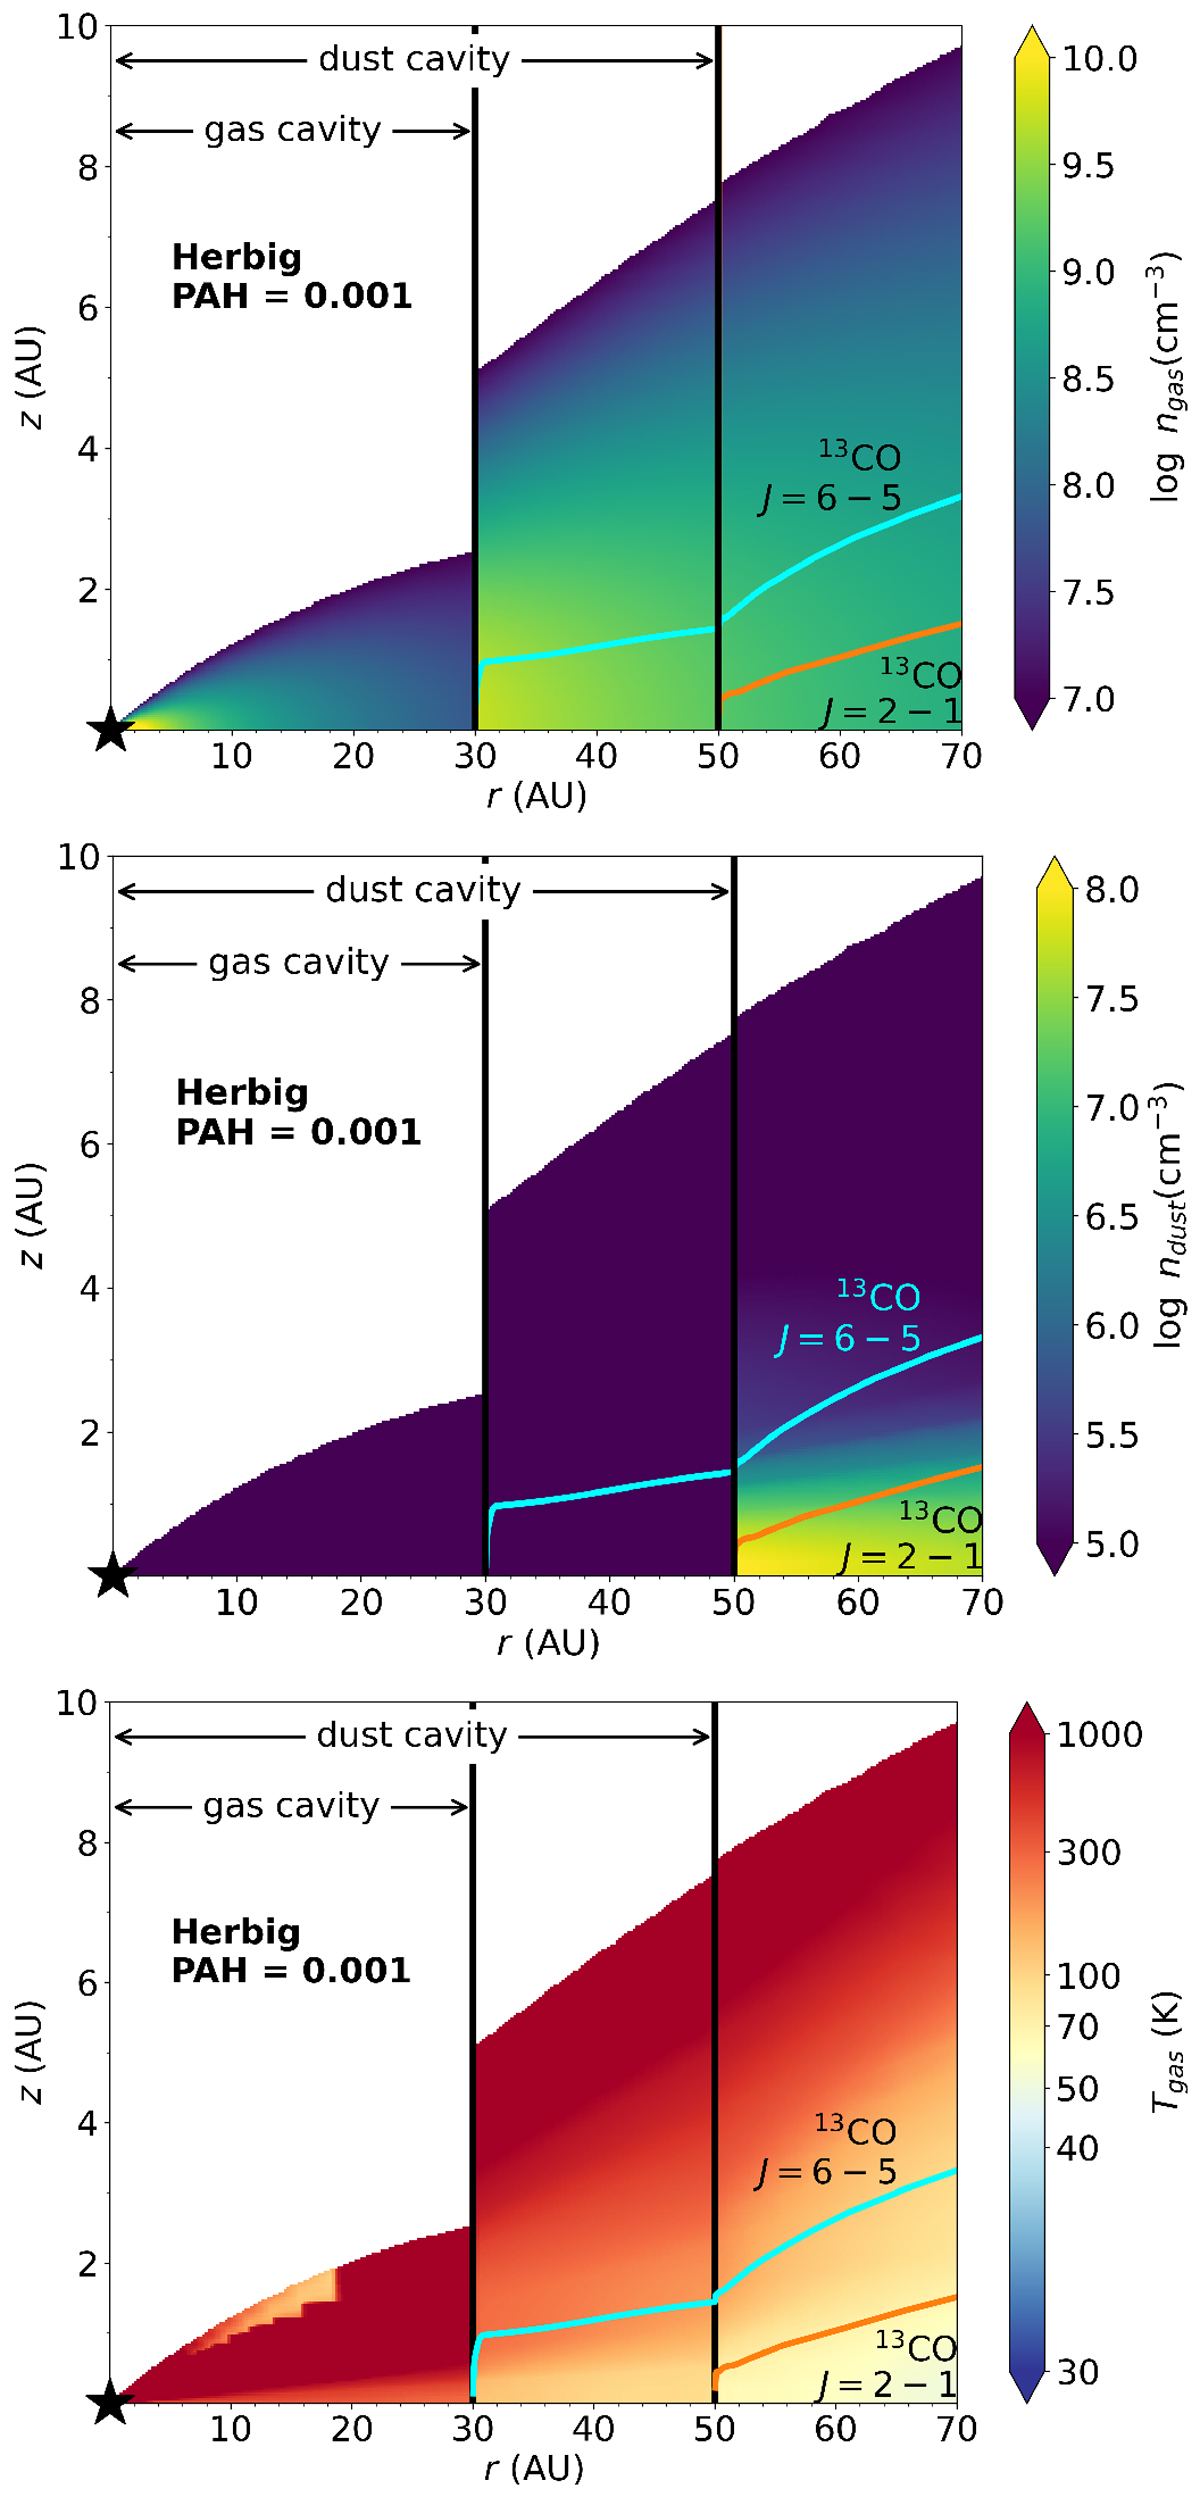
Fig. C.2
Download original image
Gas number density (top), dust density (middle), and gas temperature (bottom) of our fiducial model for a Herbig star with a factor of 100 drop in gas density inside 30 AU. The cyan and orange contours indicate the τ = 1 surface of the 13CO J = 6−5 and J = 2−1 lines, respectively. The 13CO J = 2−1 transition is optically thin inside the dust cavity, and the J = 6−5 is optically thin inside the gas cavity; hence, these lines trace the midplane at these radii. We note that the dust cavity starts from 50 AU inward and the gas cavity from 30 AU. Only the regions with a gas density above 107 cm−3 are shown. We note that the bottom panel is identical to the middle panel in Fig. 13.
Current usage metrics show cumulative count of Article Views (full-text article views including HTML views, PDF and ePub downloads, according to the available data) and Abstracts Views on Vision4Press platform.
Data correspond to usage on the plateform after 2015. The current usage metrics is available 48-96 hours after online publication and is updated daily on week days.
Initial download of the metrics may take a while.