Fig. A.5
Download original image
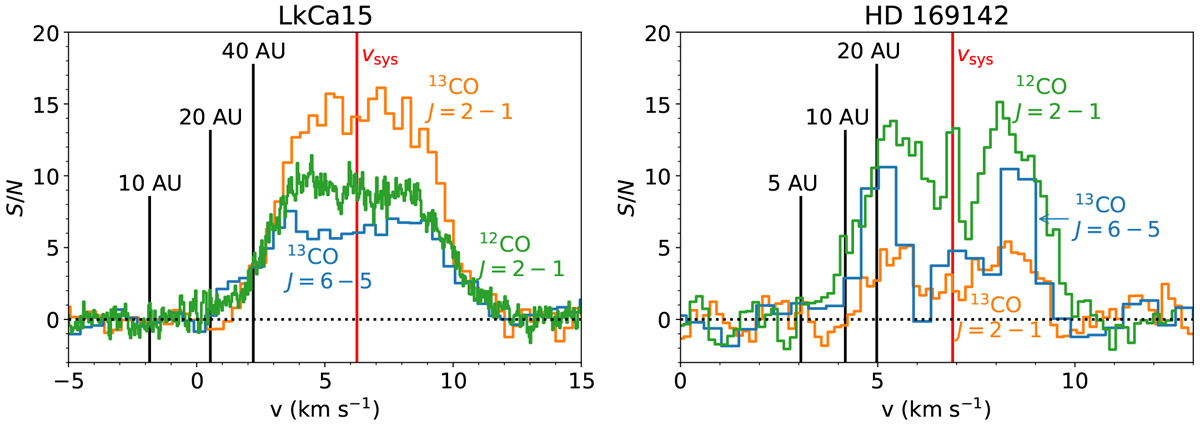
Signal-to-noise ratio of the 12CO J = 2−1, 13CO J = 2−1, and 13CO J = 6−5 spectra in the inner 1″.0 and 1″.5 for LkCal5 (left) and HD 169142 (right), resp. The systematic velocity is indicated with the vertical red line. The vertical black lines indicate the maximal velocities where emission at that radius is expected based on the Keplerian velocity profile. We note the difference in horizontal axes.
Current usage metrics show cumulative count of Article Views (full-text article views including HTML views, PDF and ePub downloads, according to the available data) and Abstracts Views on Vision4Press platform.
Data correspond to usage on the plateform after 2015. The current usage metrics is available 48-96 hours after online publication and is updated daily on week days.
Initial download of the metrics may take a while.