Fig. A.4
Download original image
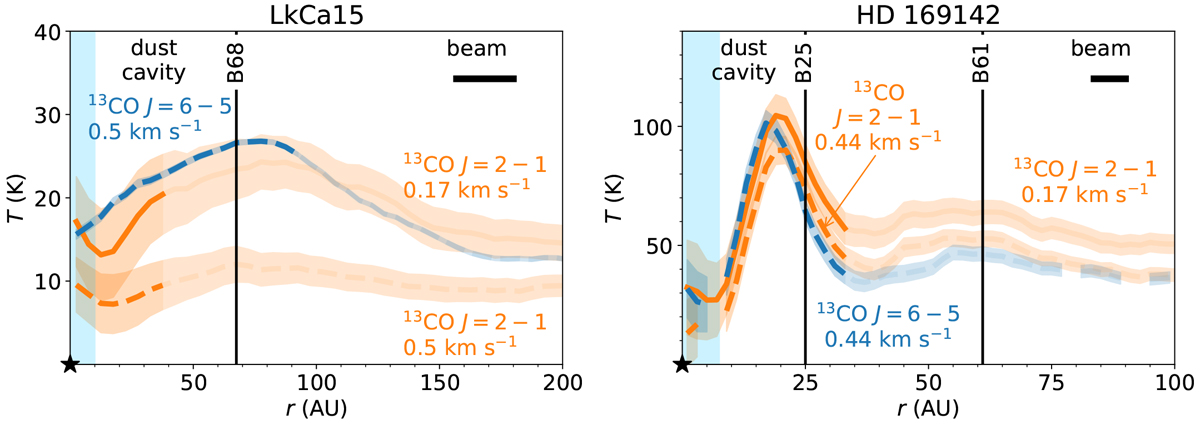
Deprojected azimuthally averaged radial profiles of the brightness temperature of the 13CO J = 2−1 (orange) and 13CO J = 6−5 (blue) transition in LkCal5 (left) and HD 169142 (right). The dashed lines show them at a spectral resolution of 0.5 km s−1 (LkCal5) and 0.44 km s−1 (HD 169142). The solid line shows the 13CO J = 2−1 transition at the native spectral resolution of 0.17 km s−1. The difference between the solid and dashed orange lines is due to the spectral resolution as the cubes are convolved to a beam of ~ 0″.17 × 0″.13 (−13.7°) (LkCal5) and 0″.057 × 0″.054 (88.6°) (HD 169142), respectively. The vertical black lines indicate the rings seen in the Band 9 continuum, and the light blue region starting from 0 AU indicates the gas cavity. The MRS of the HD 169142 J = 6−5 data corresponds to a radius of 35 AU.
Current usage metrics show cumulative count of Article Views (full-text article views including HTML views, PDF and ePub downloads, according to the available data) and Abstracts Views on Vision4Press platform.
Data correspond to usage on the plateform after 2015. The current usage metrics is available 48-96 hours after online publication and is updated daily on week days.
Initial download of the metrics may take a while.