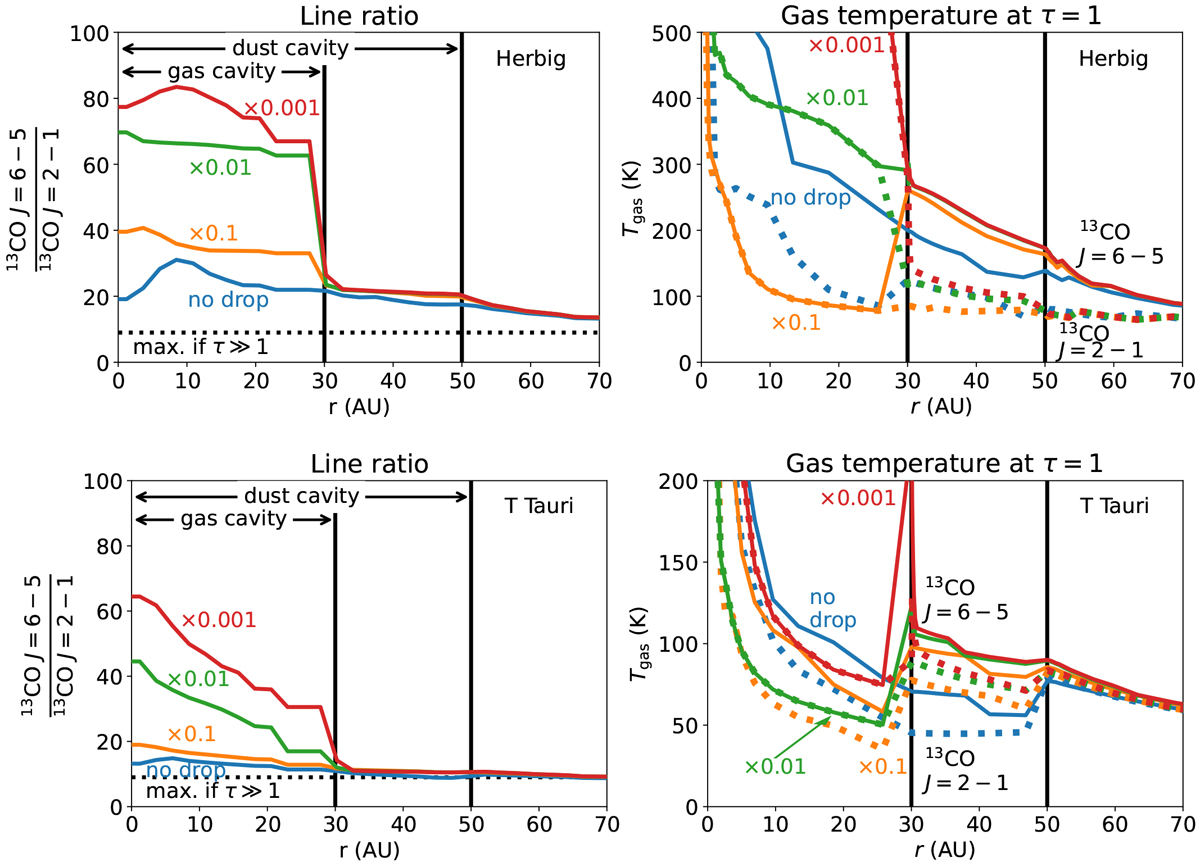
Fig. 12
Download original image
Predicted line ratio (left) and gas temperature (right) at the height where the 13CO J = 6−5 (solid) and J =2−1 (dotted) transitions become optically thick for different gas cavity depths (no drop to a factor of 0.001, colors) in the Herbig disk models (top) and Τ Tauri models (bottom). We note the different temperature scales for the two types of stars. If the transitions are optically thin, the midplane temperature is shown, as that is the region that optically thin CO lines trace in the gas cavity. The dotted horizontal line in the left panels indicates the theoretical maximum value for the line ratio if both 13CO lines are optically thick and emit from the same disk layer.
Current usage metrics show cumulative count of Article Views (full-text article views including HTML views, PDF and ePub downloads, according to the available data) and Abstracts Views on Vision4Press platform.
Data correspond to usage on the plateform after 2015. The current usage metrics is available 48-96 hours after online publication and is updated daily on week days.
Initial download of the metrics may take a while.