Open Access
Fig. 3
Download original image
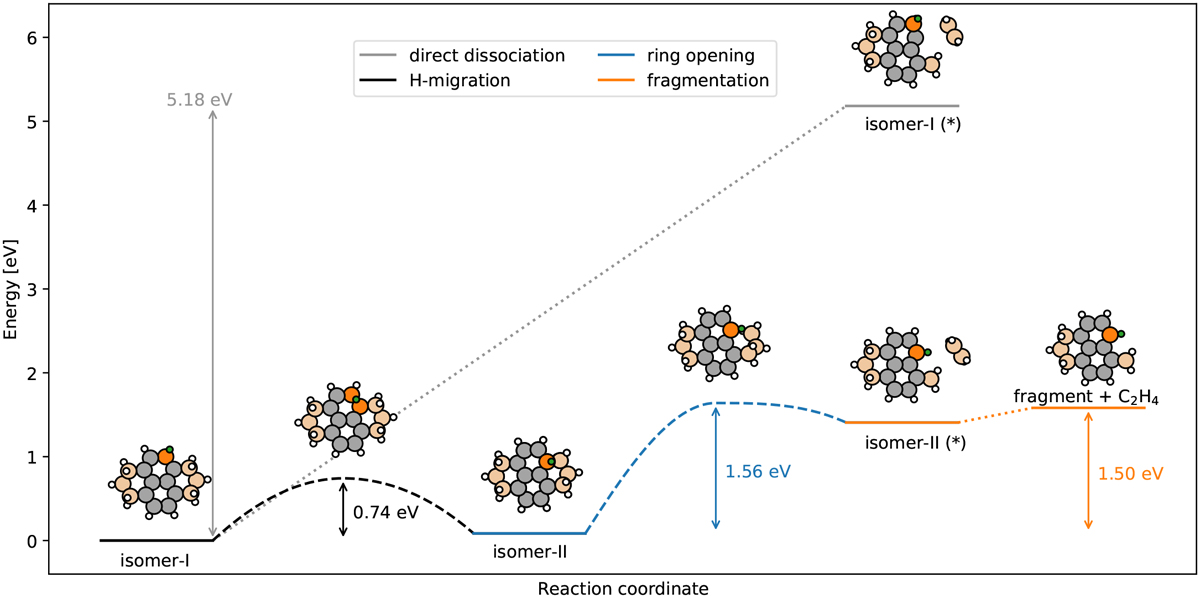
Energy profile along the pathway of C2H4 formation from [py + 7H]+. Each horizontal line corresponds to a local minimum. If a curved line is plotted between two horizontal lines, it represents a transition path with the energy barrier indicated underneath. The color scheme of atoms is the same as that of Fig. 1.
Current usage metrics show cumulative count of Article Views (full-text article views including HTML views, PDF and ePub downloads, according to the available data) and Abstracts Views on Vision4Press platform.
Data correspond to usage on the plateform after 2015. The current usage metrics is available 48-96 hours after online publication and is updated daily on week days.
Initial download of the metrics may take a while.