Fig. 9.
Download original image
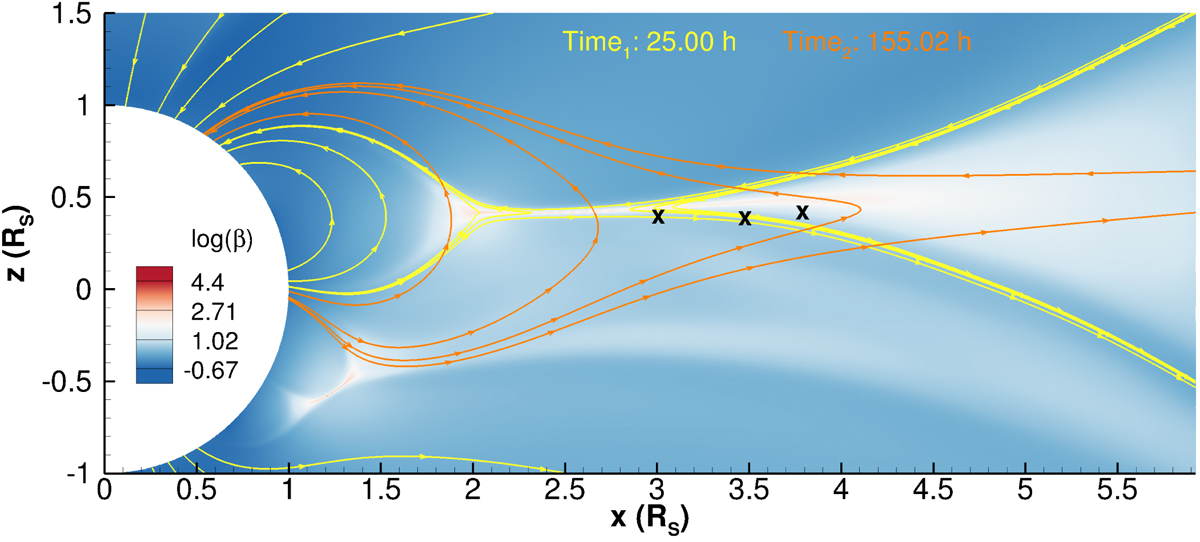
Snapshot of the plasma β (colour scale) and magnetic field lines (yellow) from the slow wind – single eruption simulation taken 25 h from the start of shearing, showing the compressed arcade and the trailing part of the CME on the right side. The orange field lines show the magnetic configuration of the northern arcade from the same simulation, after it has relaxed to its original state, 155 h from the start of shearing. The X-points form between the streamer cusp and blobs and evolve further from the Sun as time increases.
Current usage metrics show cumulative count of Article Views (full-text article views including HTML views, PDF and ePub downloads, according to the available data) and Abstracts Views on Vision4Press platform.
Data correspond to usage on the plateform after 2015. The current usage metrics is available 48-96 hours after online publication and is updated daily on week days.
Initial download of the metrics may take a while.