Open Access
Fig. 8.
Download original image
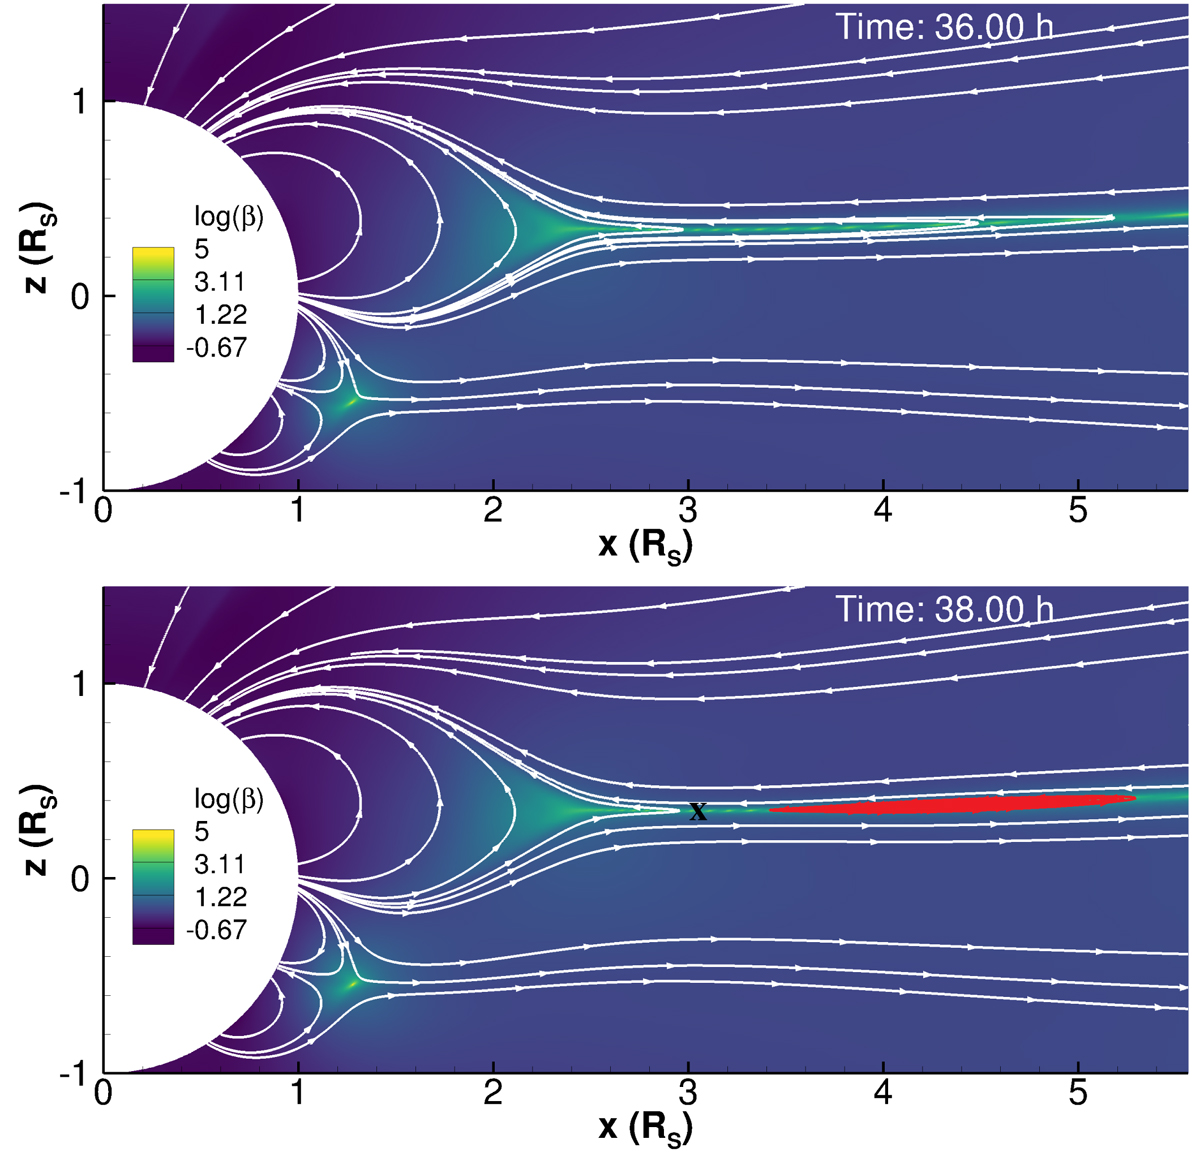
Snapshots of the plasma β from the slow wind – single eruption simulations taken at 36 h (top panel) and at 38 h (bottom panel), depicting the formation of a plasma blob (red field lines) from the northern streamer cusp. The X-point created between the blob and the streamer cusp is indicated (X) in the bottom panel.
Current usage metrics show cumulative count of Article Views (full-text article views including HTML views, PDF and ePub downloads, according to the available data) and Abstracts Views on Vision4Press platform.
Data correspond to usage on the plateform after 2015. The current usage metrics is available 48-96 hours after online publication and is updated daily on week days.
Initial download of the metrics may take a while.