Fig. 7.
Download original image
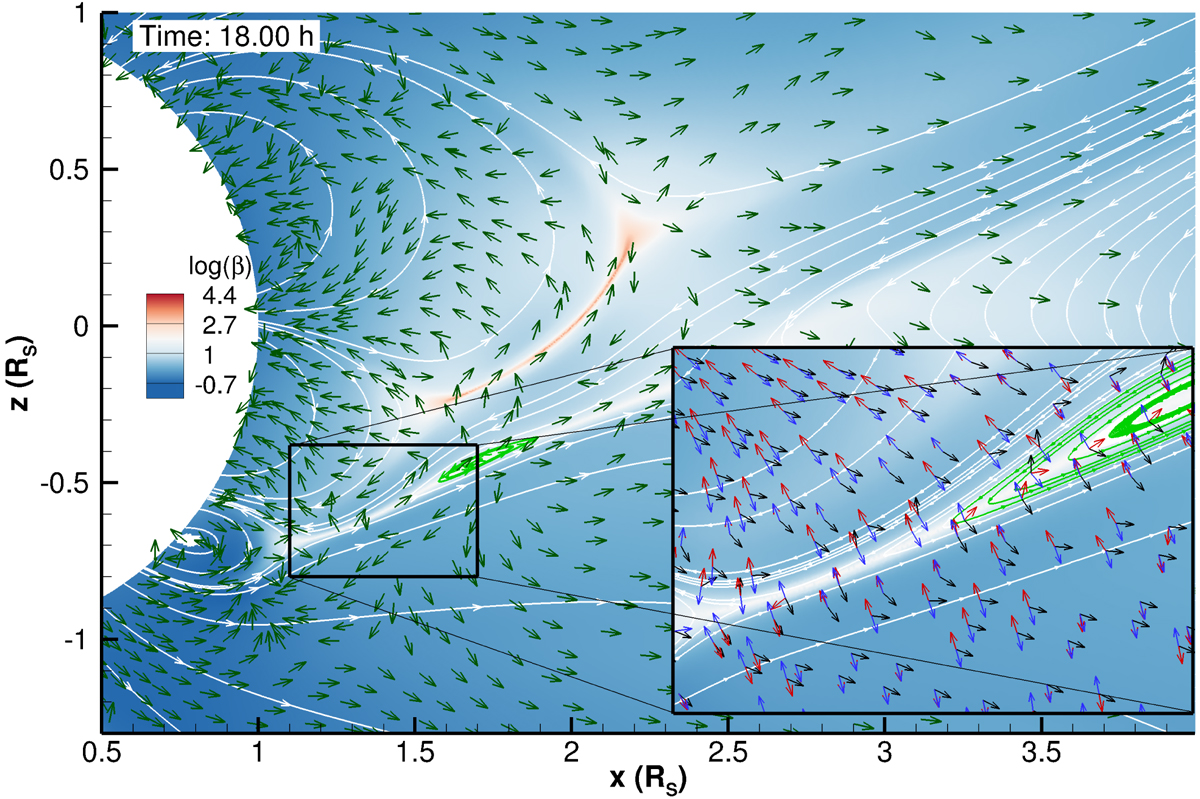
Same as Fig. 6, but for a larger field of view, taken 18 h after the start of shearing. The green field lines represent the stealth ejecta formed in the current sheet trailing CME1. Bottom right panel: enlarged view of the black rectangle showing the current sheet in which the stealth ejecta forms; the colour scale depicts plasma β, and the vectors are TB (red), −∇PB (blue), and −∇PP (black).
Current usage metrics show cumulative count of Article Views (full-text article views including HTML views, PDF and ePub downloads, according to the available data) and Abstracts Views on Vision4Press platform.
Data correspond to usage on the plateform after 2015. The current usage metrics is available 48-96 hours after online publication and is updated daily on week days.
Initial download of the metrics may take a while.