Fig. 5.
Download original image
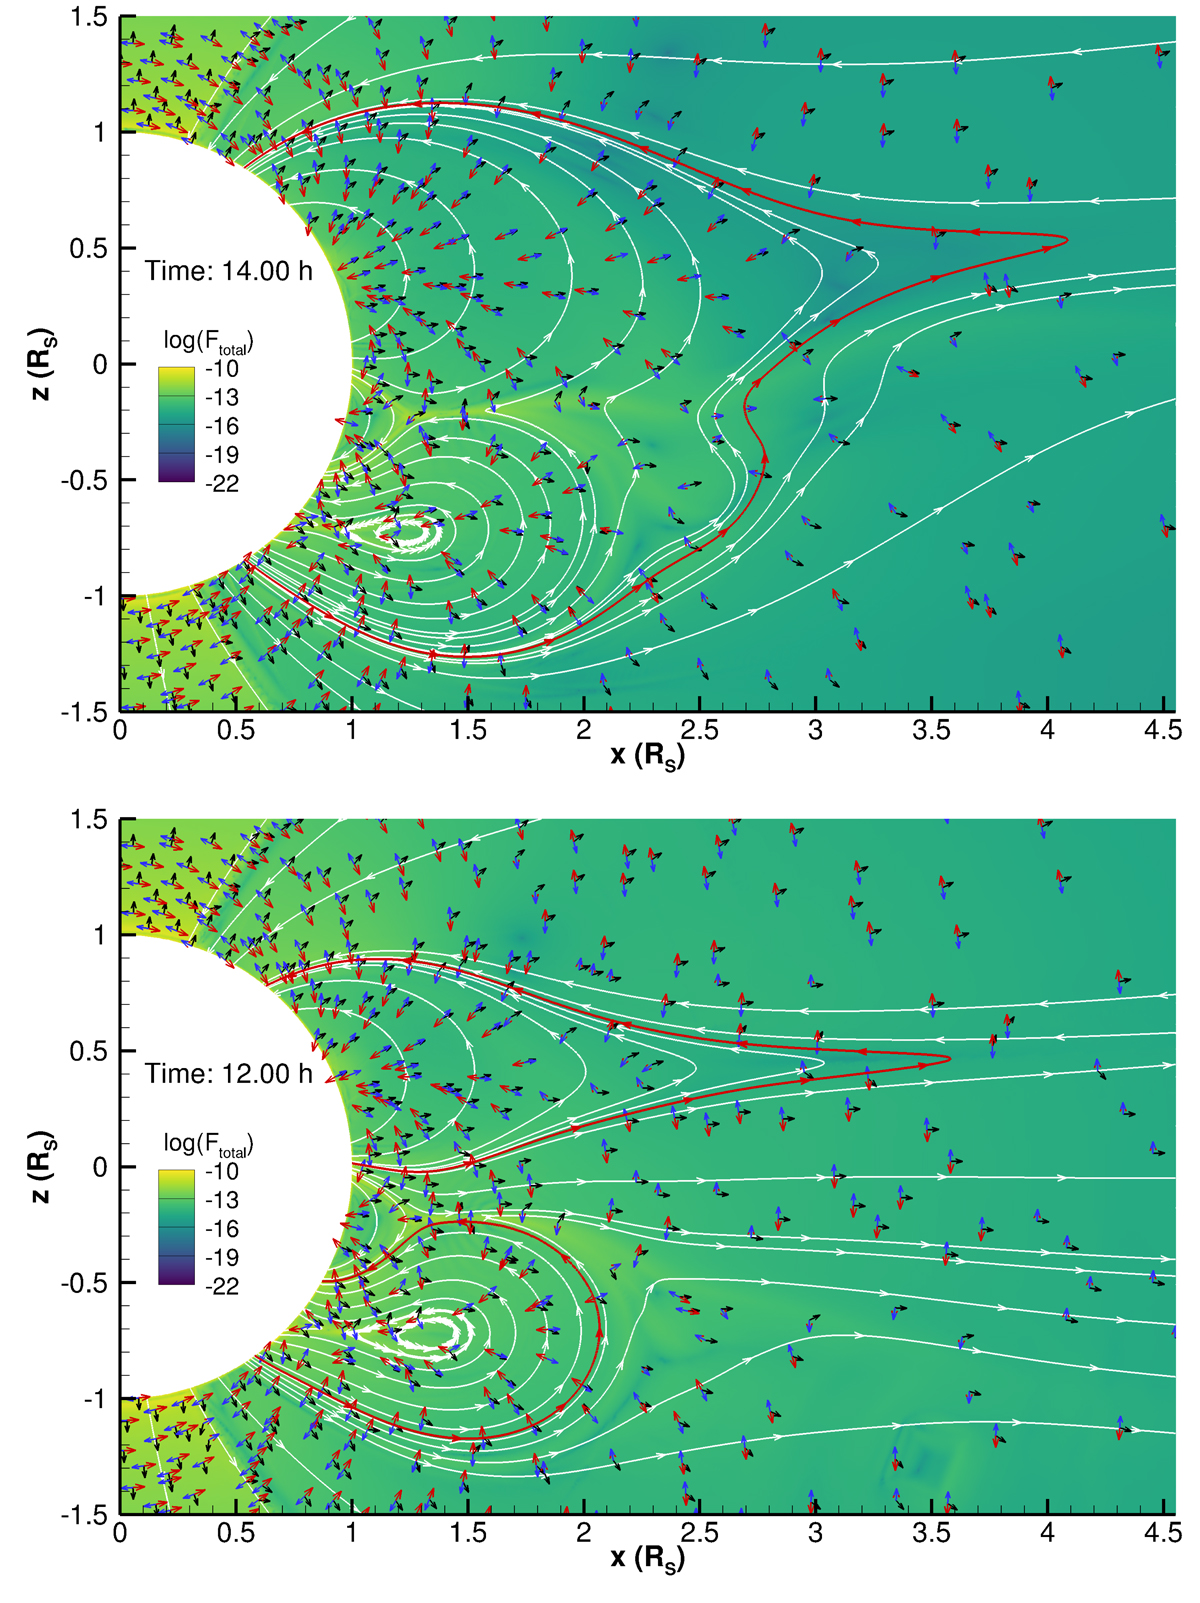
Simulation snapshots of the total force (colour scale) during the single eruption in the slow-wind (top panel) and faster-wind case (bottom panel). The white and red lines represent selected magnetic field lines. The vectors indicate the following forces: TB (red), −∇PB (blue), and −∇PP (black). The snapshots were taken at 14 h (top) and 12 h (bottom) from the start of shearing, such that the front of both CMEs is at ≈2 R⊙.
Current usage metrics show cumulative count of Article Views (full-text article views including HTML views, PDF and ePub downloads, according to the available data) and Abstracts Views on Vision4Press platform.
Data correspond to usage on the plateform after 2015. The current usage metrics is available 48-96 hours after online publication and is updated daily on week days.
Initial download of the metrics may take a while.