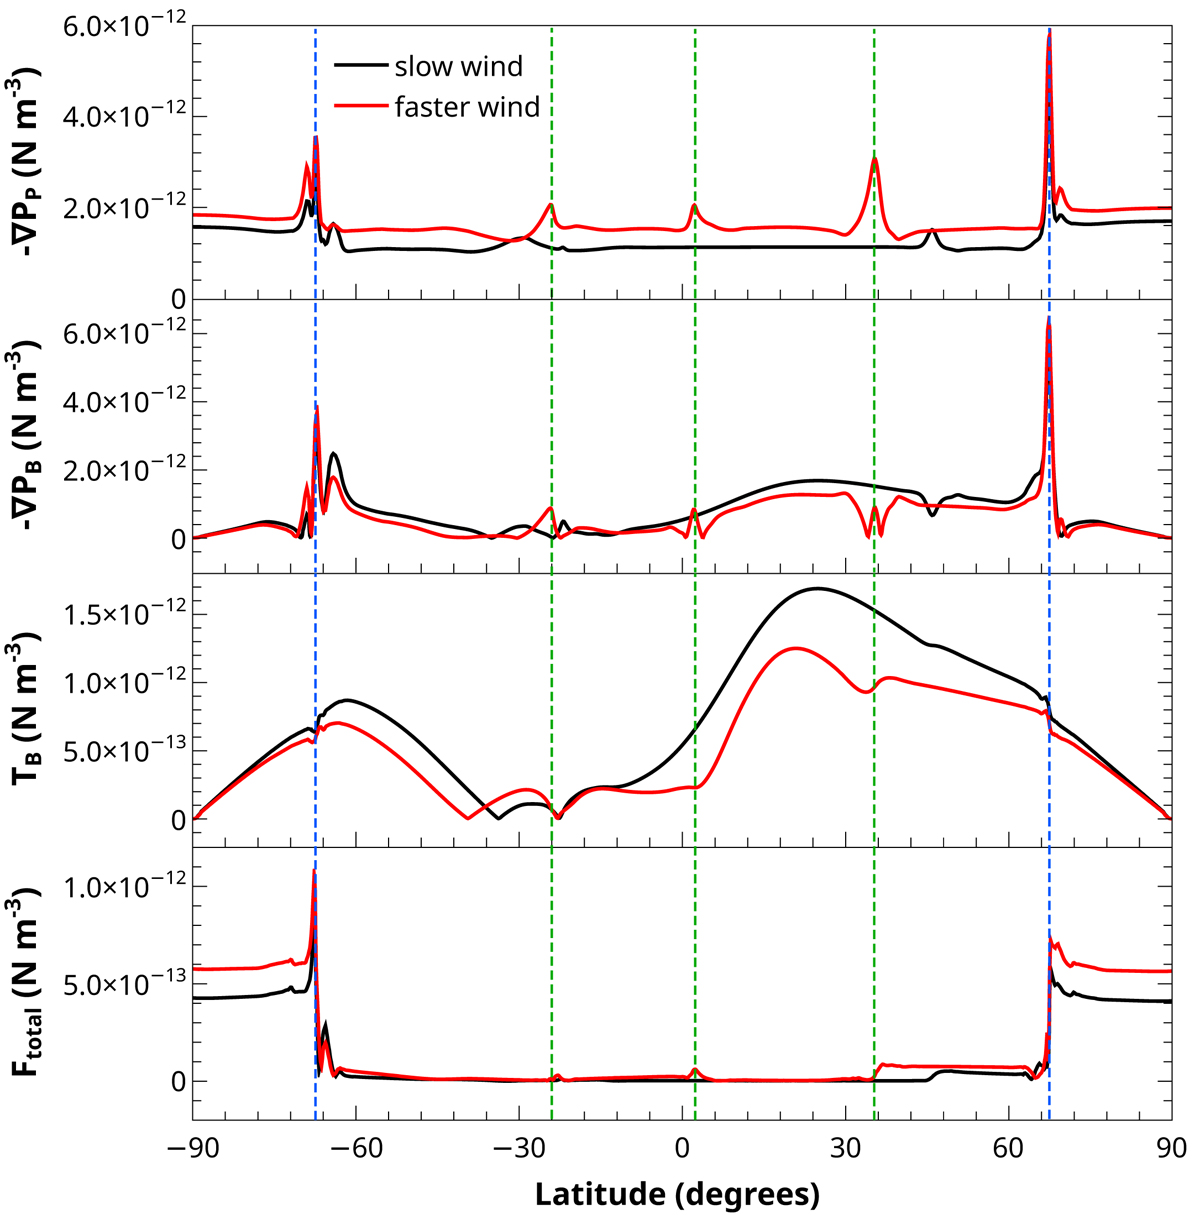
Fig. 3.
Download original image
Forces extracted from the 1D cut at 1.5 R⊙ (blue semicircles in Fig. 4) in the cases of slow (black line) and faster background solar wind (red line). The force densities (top to bottom) are the following: plasma pressure gradient (−∇PP), magnetic pressure gradient (−∇PB), magnetic tension (TB), and total force (Ftotal). The dashed blue lines indicate the interface between slow and fast wind, here referred to as latitudinal components of the same background wind simulation. The dashed green lines represent peaks in −∇PP in the faster-wind case (here referred to as the separate simulation case), which is identified by the white circles in Fig. 4.
Current usage metrics show cumulative count of Article Views (full-text article views including HTML views, PDF and ePub downloads, according to the available data) and Abstracts Views on Vision4Press platform.
Data correspond to usage on the plateform after 2015. The current usage metrics is available 48-96 hours after online publication and is updated daily on week days.
Initial download of the metrics may take a while.