Open Access
Fig. 2.
Download original image
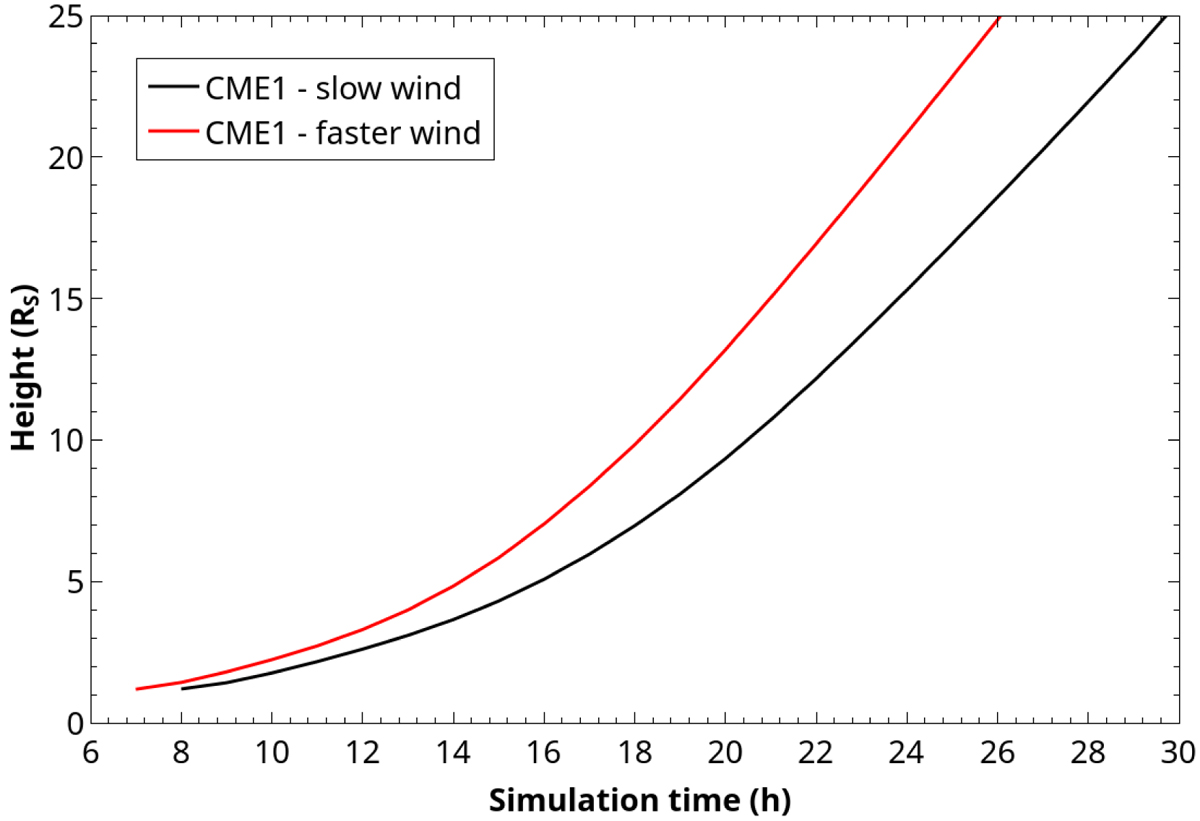
Height-time plot of the centre of the flux rope associated with the first CME in the cases of slow wind – eruption + stealth (black line), and faster wind – stealth speed (red line). The height is calculated from the centre of the Sun, and the simulation time is from the start of the shearing motions.
Current usage metrics show cumulative count of Article Views (full-text article views including HTML views, PDF and ePub downloads, according to the available data) and Abstracts Views on Vision4Press platform.
Data correspond to usage on the plateform after 2015. The current usage metrics is available 48-96 hours after online publication and is updated daily on week days.
Initial download of the metrics may take a while.