Fig. 14.
Download original image
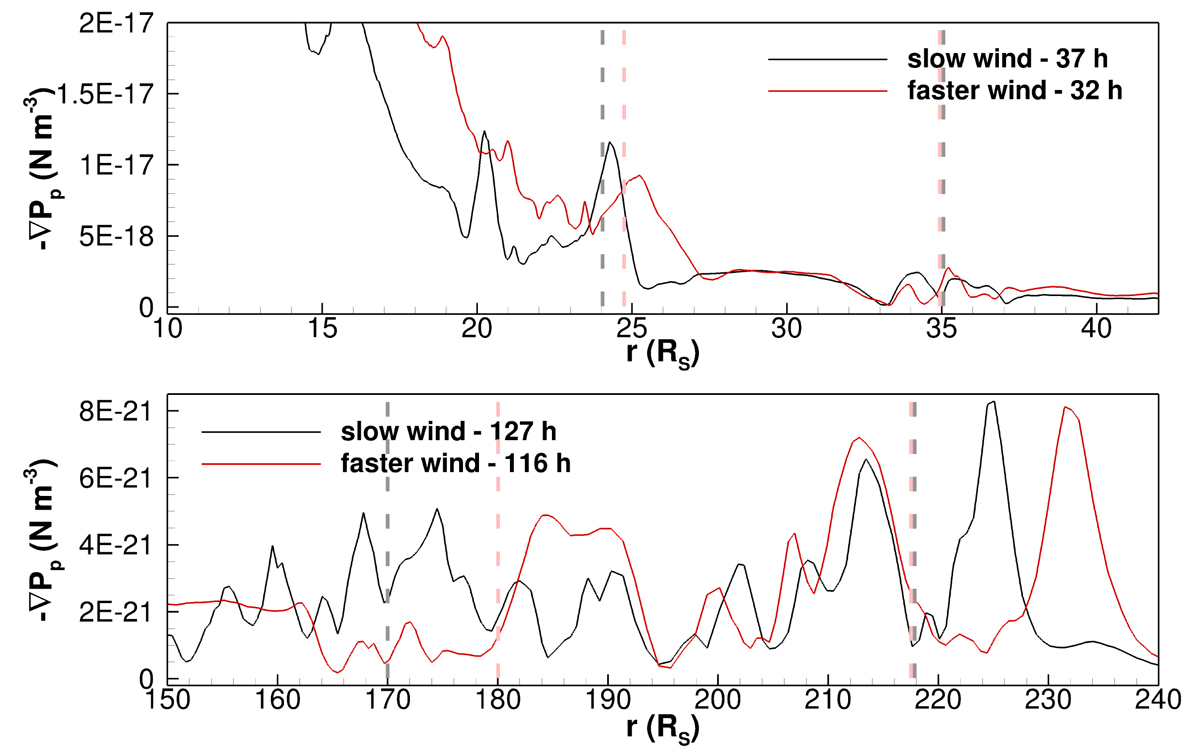
Plasma pressure gradient values extracted from the equatorial cross-section through the single eruptions depicted in Fig. 13, propagating in the slow background solar wind (black line) and in the faster wind (red line). The panels show results for two distance ranges that include the main flux rope, which is approximately delineated by the dashed grey and pink lines in the slow and faster solar wind, respectively.
Current usage metrics show cumulative count of Article Views (full-text article views including HTML views, PDF and ePub downloads, according to the available data) and Abstracts Views on Vision4Press platform.
Data correspond to usage on the plateform after 2015. The current usage metrics is available 48-96 hours after online publication and is updated daily on week days.
Initial download of the metrics may take a while.