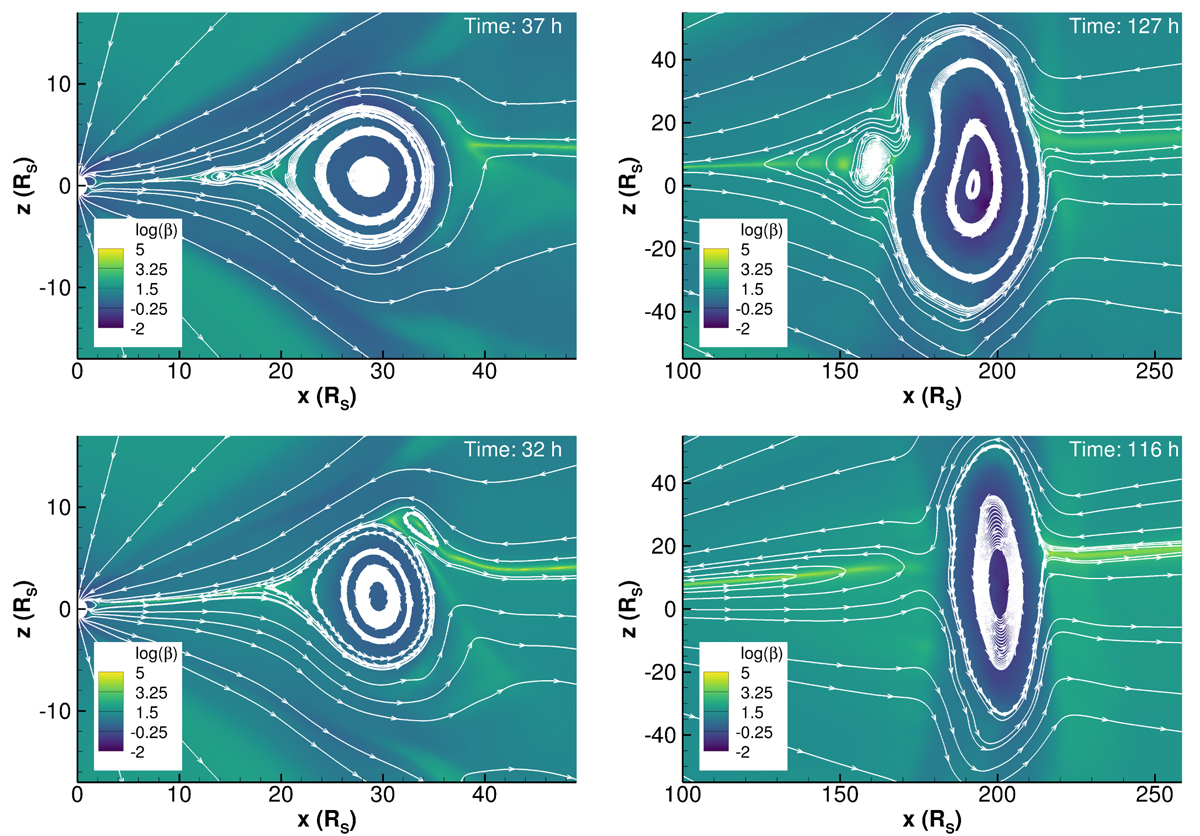
Fig. 13.
Download original image
Snapshots of the CMEs in the single eruption cases, propagating in the slow (top row) and faster (bottom row) background solar winds. The first column shows the CMEs when the front of the flux ropes are at ≈35 R⊙, and the second column when they reach 1 AU. Each snapshot was taken at the times indicated in the respective panels, counted from the start of shearing. The colour scale depicts plasma β values, and the white lines represent selected magnetic field lines.
Current usage metrics show cumulative count of Article Views (full-text article views including HTML views, PDF and ePub downloads, according to the available data) and Abstracts Views on Vision4Press platform.
Data correspond to usage on the plateform after 2015. The current usage metrics is available 48-96 hours after online publication and is updated daily on week days.
Initial download of the metrics may take a while.