Fig. 12.
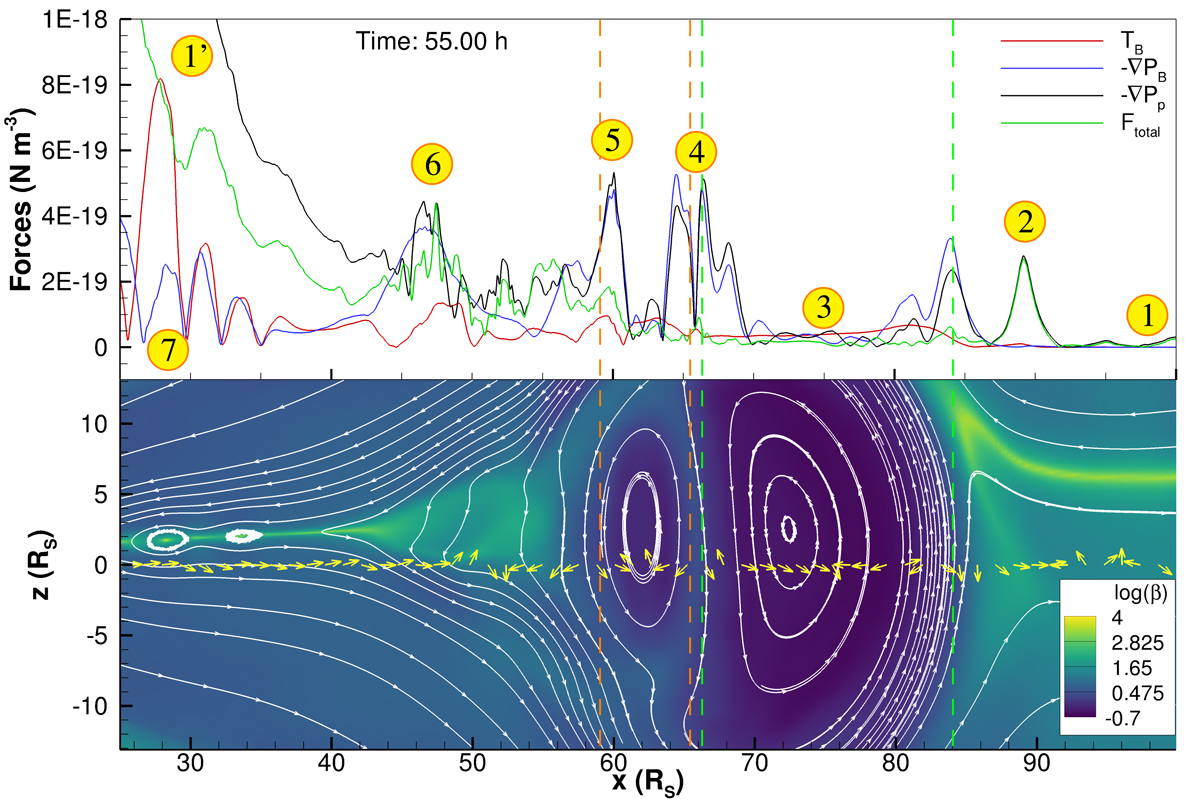
Download original image
Snapshots of the evolution of the CMEs in the slow wind – double eruption case, taken 55 h after the start of shearing. Top: forces extracted from an equatorial 1D slice through this configuration. Bottom: snapshot of the plasma β (colour scale) and selected magnetic field lines. The 1D slice in the top panel was extracted from this same configuration. The numbers indicate the following features, described more extensively in the text: 1 and 1′– solar wind in front of or trailing the CMEs; 2 – plasma compression front; 3 – core of CME1; 4 – compression zone between the two CMEs; 5 – end of second flux rope; 6 – tail of the CMEs; and 7 – plasma blobs. The dashed green and orange lines delimit the two flux ropes. The yellow vectors represent the total force along the 1D slice.
Current usage metrics show cumulative count of Article Views (full-text article views including HTML views, PDF and ePub downloads, according to the available data) and Abstracts Views on Vision4Press platform.
Data correspond to usage on the plateform after 2015. The current usage metrics is available 48-96 hours after online publication and is updated daily on week days.
Initial download of the metrics may take a while.