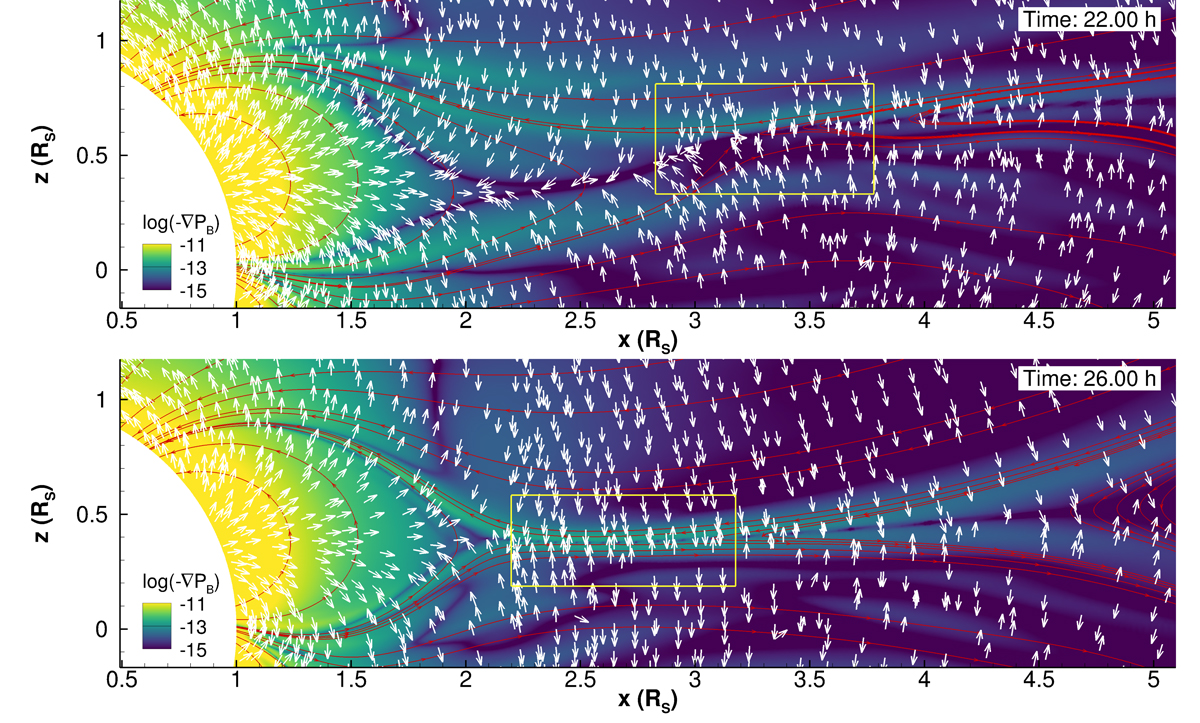
Fig. 11.
Download original image
Snapshots of the magnetic pressure gradient (colour scale) depicting the formation of current sheets in the aftermath of CMEs in the single-eruption case inserted into the faster background wind (top panel) and slow wind (bottom panel). The white vectors represent −∇PB, and the red lines are selected magnetic field lines. The yellow rectangles are regions of interest, as discussed in the text.
Current usage metrics show cumulative count of Article Views (full-text article views including HTML views, PDF and ePub downloads, according to the available data) and Abstracts Views on Vision4Press platform.
Data correspond to usage on the plateform after 2015. The current usage metrics is available 48-96 hours after online publication and is updated daily on week days.
Initial download of the metrics may take a while.