Fig. 10.
Download original image
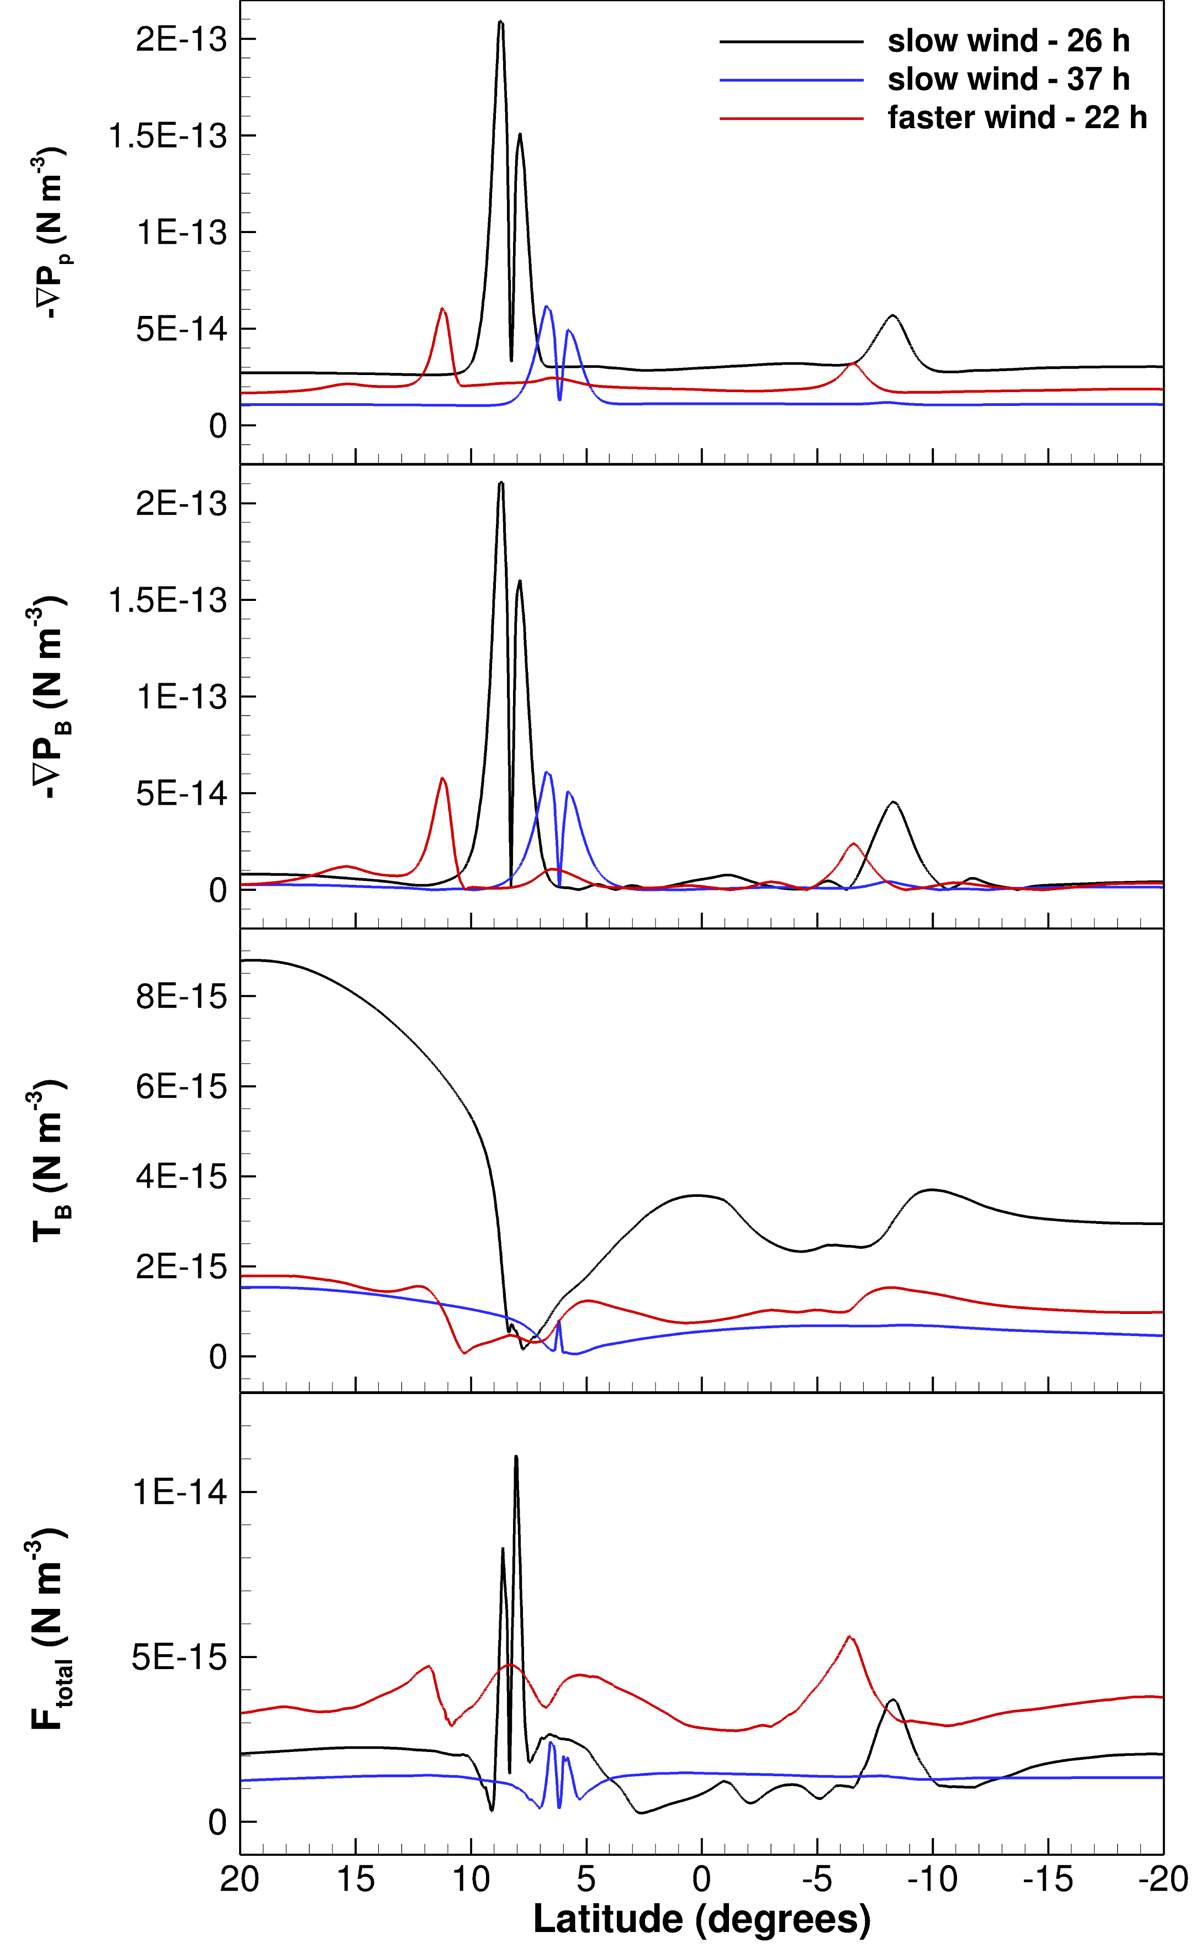
Forces extracted from a latitudinal cut through the current sheet occurring in the aftermath of eruptions at different heights and simulation times. The slices were taken through the slow wind – single eruption simulation at 2.62 R⊙ and 26 h from the start of shearing (black line), and at 3.2 R⊙ and 37 h (blue line), and through the faster wind – single eruption at 3.3 R⊙, 22 h from the start of shearing (red line).
Current usage metrics show cumulative count of Article Views (full-text article views including HTML views, PDF and ePub downloads, according to the available data) and Abstracts Views on Vision4Press platform.
Data correspond to usage on the plateform after 2015. The current usage metrics is available 48-96 hours after online publication and is updated daily on week days.
Initial download of the metrics may take a while.