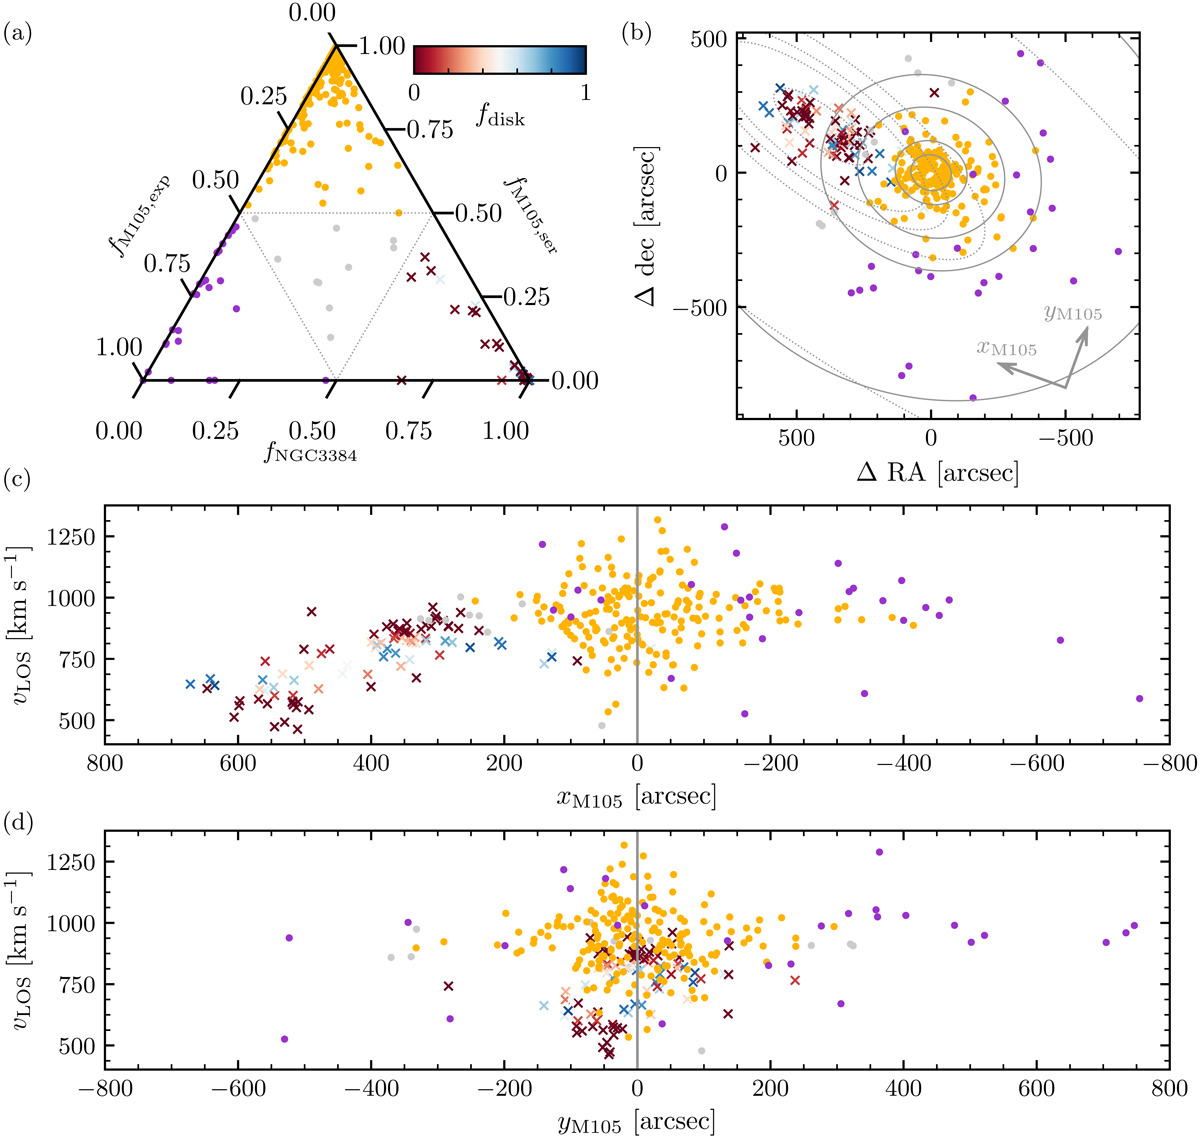
Fig. 9.
Download original image
Panel a: ternary plot of the probabilistic fractions fi with fM 105, Ser > 0.5 coloured in orange, fM 105, Exp > 0.5 coloured in purple, and fNGC 3384 > 0.5 represented by crosses on a red-to-blue colour scale with red colours for fNGC 3384, bulge > 0.5 and blue colours for fNGC 3384, disk > 0.5. Points coloured in grey do not satisfy any of the four criteria, and their association with any of the components cannot be conclusively ascertained. Panel b: spatial distribution of PNe with the same colour coding as in panel a. Panel c: velocity phase-space along the major axis of M 105 with the same colour coding as in panel a. Panel d: velocity phase-space along the minor axis of M 105 with the same colour coding as in panel a.
Current usage metrics show cumulative count of Article Views (full-text article views including HTML views, PDF and ePub downloads, according to the available data) and Abstracts Views on Vision4Press platform.
Data correspond to usage on the plateform after 2015. The current usage metrics is available 48-96 hours after online publication and is updated daily on week days.
Initial download of the metrics may take a while.