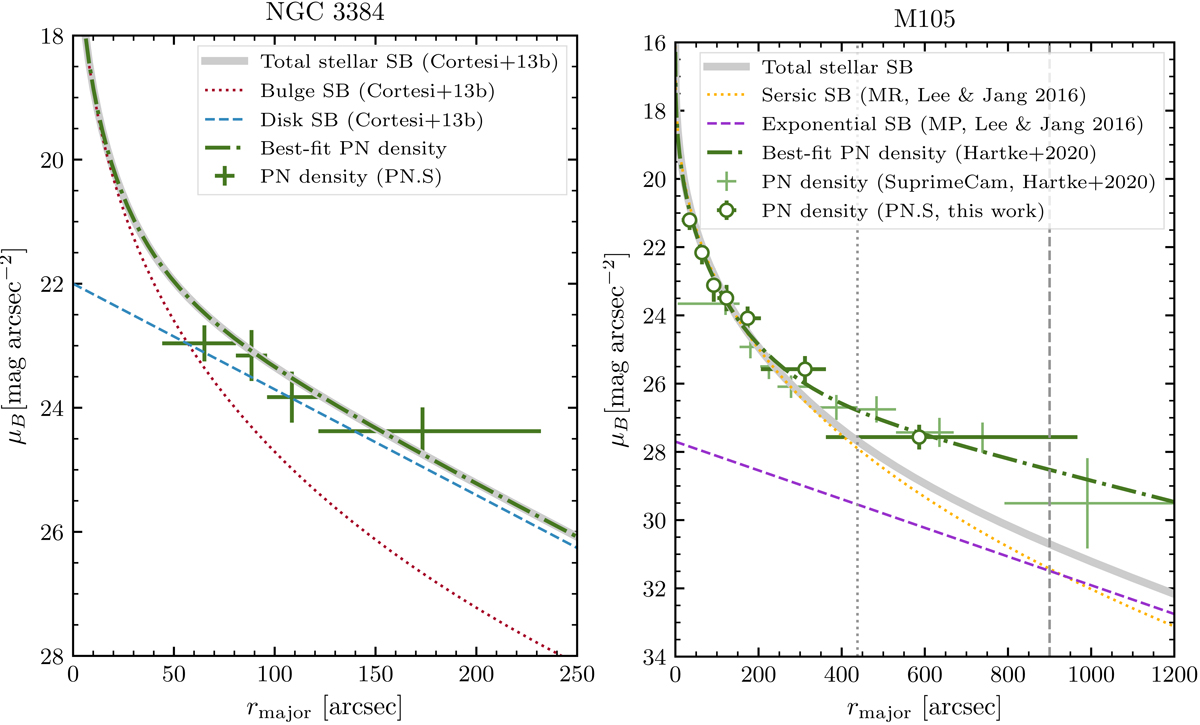
Fig. 7.
Download original image
Stellar SB profiles of NGC 3384 and M 105 in comparison with PN number density profiles scaled by the respective α-parameters. In both panels, the solid grey line denotes the total stellar SB, and the dark green error bars show the PN number density based on data from the PN.S. Left: stellar SB profile of NGC 3384 decomposed into bulge (dotted red line) and disk (dashed blue line) by Cortesi et al. (2013b) and the best-fit PN number density profile is denoted by the dash-dotted green line. Right: stellar SB profile of M 105 decomposed into Sérsic (dotted orange line) and exponential (dashed purple line) components by H+2020 with priors on the number-densities of metal-poor and metal-rich RGB stars from Lee & Jang (2016) and fit to the PN number density from Surprime-Cam data alone (light green error bars). The grey dotted vertical line denotes the radius at which the PN number density starts to deviate from the stellar SB profile and the dashed vertical line where the exponential SB starts to dominate the total light distribution.
Current usage metrics show cumulative count of Article Views (full-text article views including HTML views, PDF and ePub downloads, according to the available data) and Abstracts Views on Vision4Press platform.
Data correspond to usage on the plateform after 2015. The current usage metrics is available 48-96 hours after online publication and is updated daily on week days.
Initial download of the metrics may take a while.