Free Access
Fig. 6.
Download original image
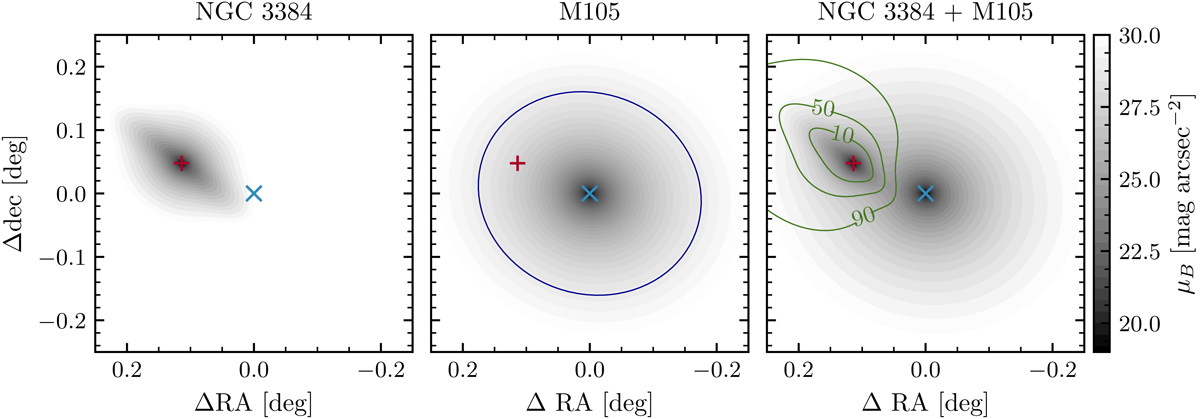
Modelled SB maps of NGC 3384 (left) and M 105 (centre), with the centres of the galaxies marked with red and blue crosses, respectively. Right panel: composite SB map from both galaxies and green contours where M 105 contributes 90%, 50%, and 10% of the total light distribution.
Current usage metrics show cumulative count of Article Views (full-text article views including HTML views, PDF and ePub downloads, according to the available data) and Abstracts Views on Vision4Press platform.
Data correspond to usage on the plateform after 2015. The current usage metrics is available 48-96 hours after online publication and is updated daily on week days.
Initial download of the metrics may take a while.