Fig. 5.
Download original image
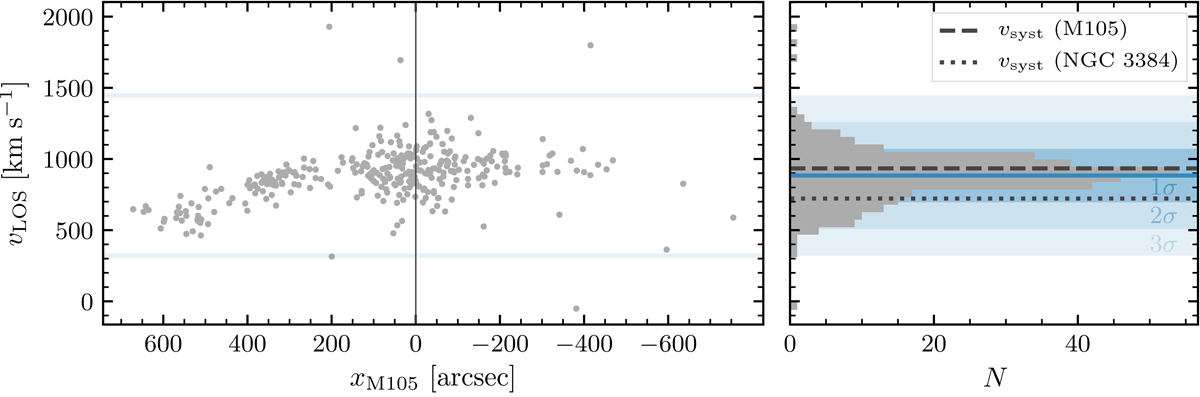
Left: phase-space of PN candidates in the e2PN.S survey footprint, including PNe associated with M 105 and NGC 3384. The major axis of M 105 is denoted with xM 105. Right: line-of-sight velocity histogram of the objects shown in the left panel. The dashed line denotes the systemic velocity of M 105, and the solid blue line the mean velocity of the sample. The blue shaded regions denote the 1, 2, and 3σ intervals from the mean. Objects beyond 3σ of the mean velocity are likely redshifted background emission-line galaxies.
Current usage metrics show cumulative count of Article Views (full-text article views including HTML views, PDF and ePub downloads, according to the available data) and Abstracts Views on Vision4Press platform.
Data correspond to usage on the plateform after 2015. The current usage metrics is available 48-96 hours after online publication and is updated daily on week days.
Initial download of the metrics may take a while.