Fig. 3.
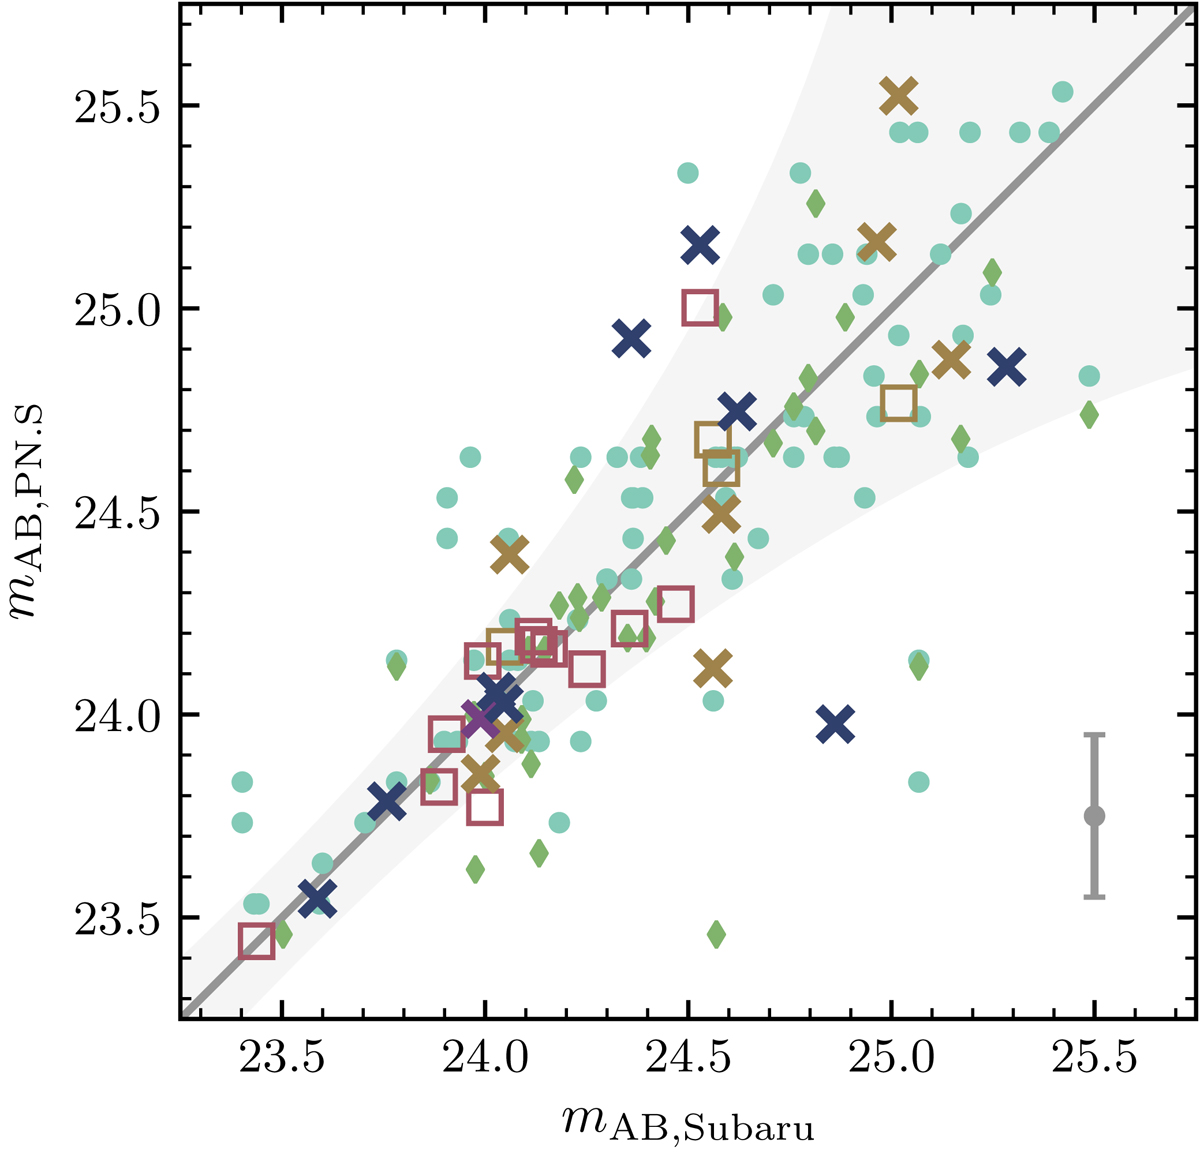
Download original image
Comparison of the AB magnitudes of PN candidates from H+2020 with those from the e2PN.S survey. The colour coding is the same as in the left panel of Fig. 1. The grey shaded region indicates where 99% of Subaru sources would fall if one plotted two independent measurements of their magnitudes mAB, Subaru against each other H+2020. The error bar in the lower right corner denotes the typical magnitude uncertainty of the PN.S.
Current usage metrics show cumulative count of Article Views (full-text article views including HTML views, PDF and ePub downloads, according to the available data) and Abstracts Views on Vision4Press platform.
Data correspond to usage on the plateform after 2015. The current usage metrics is available 48-96 hours after online publication and is updated daily on week days.
Initial download of the metrics may take a while.