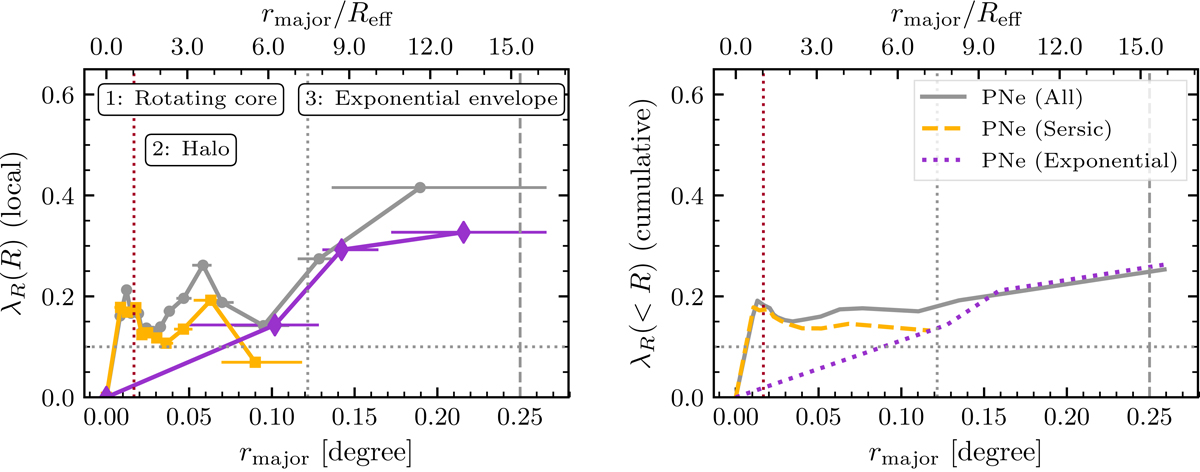
Fig. 14.

Download original image
Left: local λR profiles calculated for the total sample of PNe associated with M 105 (grey), its Sérsic component (orange), and the exponential envelope (purple). Horizontal error bars denote the bins in which λR was evaluated. Right: cumulative λR profiles, with the same colour coding as in the left panel. In both panels, the dotted grey line at λR = 0.1 separates fast from slow rotator regions assuming constant ellipticity (Emsellem et al. 2007). The vertical dotted lines are the same as in Fig. 11.
Current usage metrics show cumulative count of Article Views (full-text article views including HTML views, PDF and ePub downloads, according to the available data) and Abstracts Views on Vision4Press platform.
Data correspond to usage on the plateform after 2015. The current usage metrics is available 48-96 hours after online publication and is updated daily on week days.
Initial download of the metrics may take a while.


