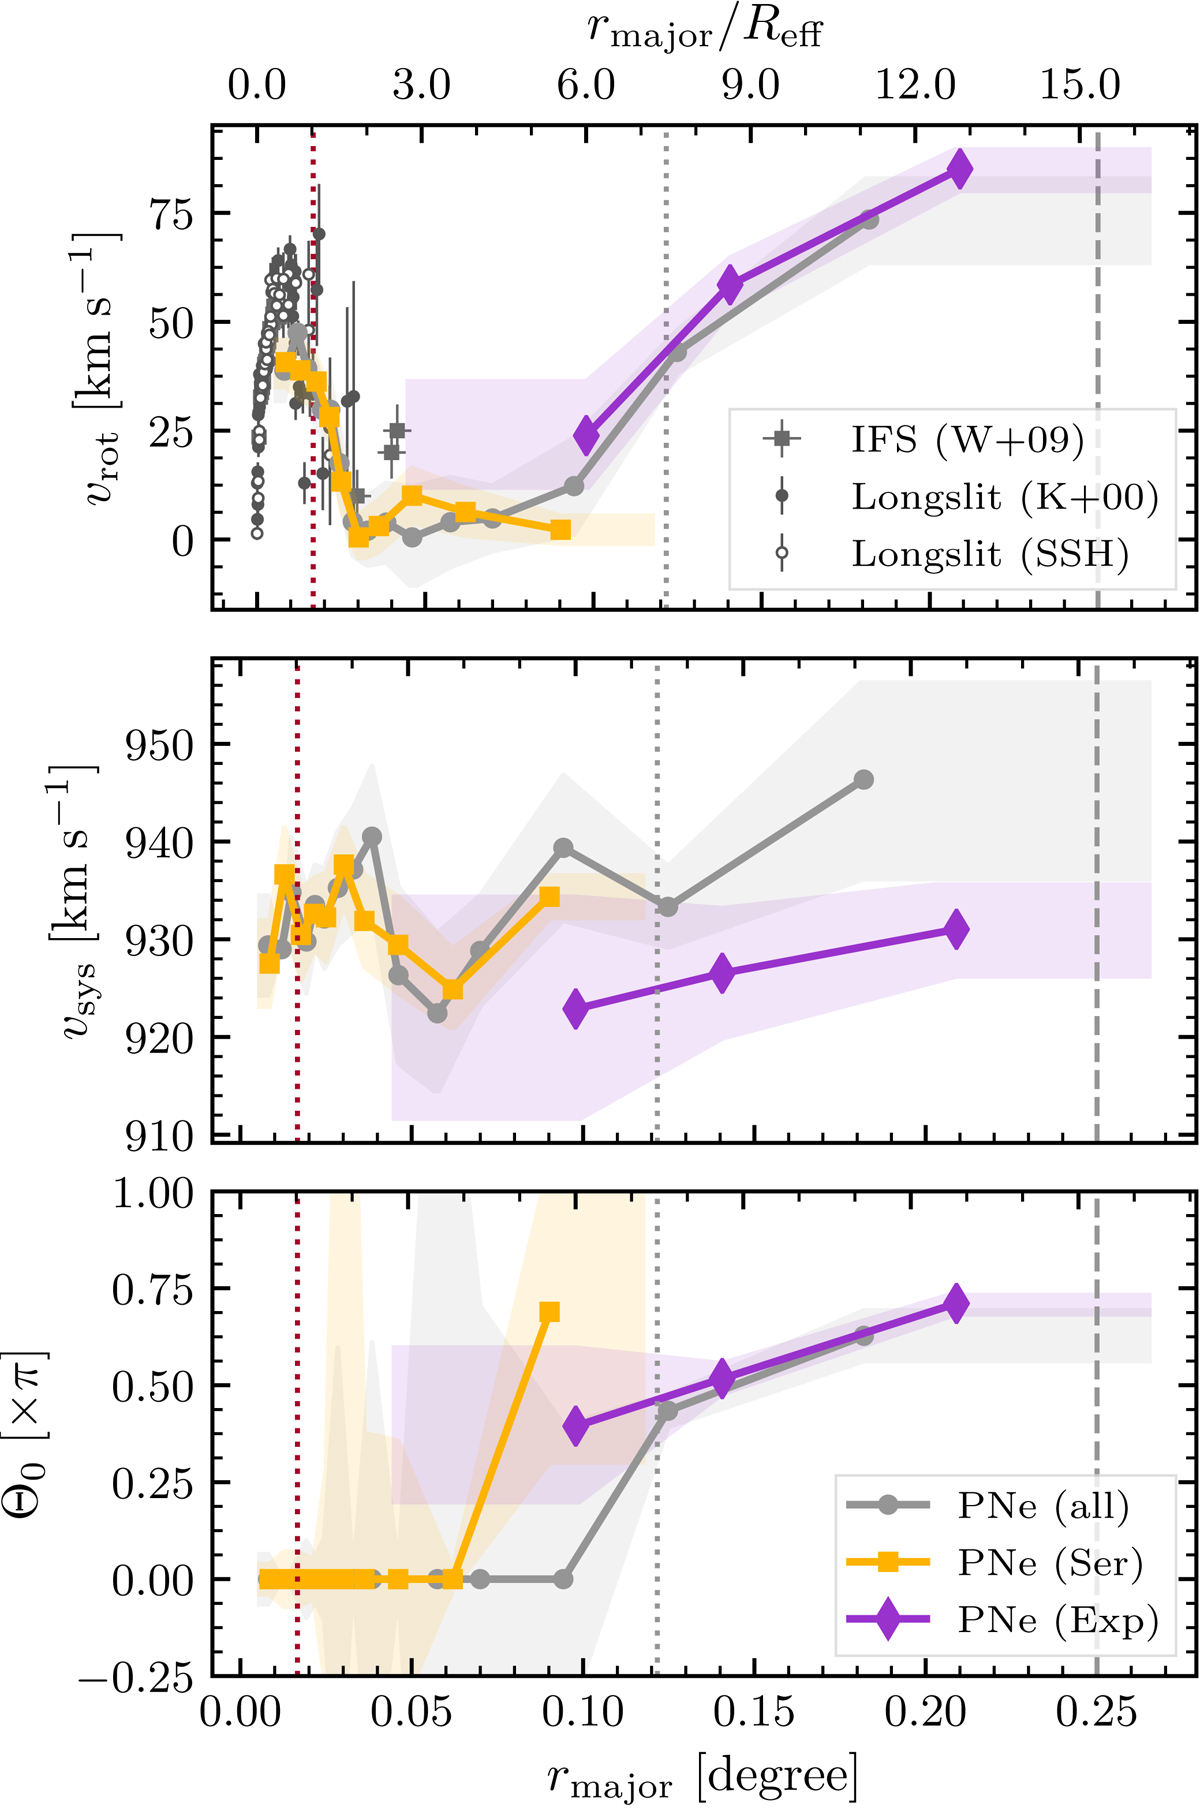
Fig. 13.
Download original image
Top: rotation amplitude along the major axis of M 105 for all PNe associated with the galaxy (grey circles), and the Sérsic (orange squares) and exponential (purple diamonds) components. The black circles with associated error bars denote the rotation profile derived from long-slit spectroscopy (Kronawitter et al. (2000, filled symbols), (Statler & Smecker-Hane 1999, open symbols)) and the grey squares that from integral-field spectroscopy (Weijmans et al. 2009). Middle: systemic velocity as a function of major-axis radius with the same colour coding as in the top panel. Bottom: best-fit kinematic position angle with respect to the photometric one as a function of major-axis radius with the same colour coding as in the top panel. In both panels, shaded regions indicate the standard errors from the maximum-likelihood fit and the vertical lines are the same as in Fig. 11.
Current usage metrics show cumulative count of Article Views (full-text article views including HTML views, PDF and ePub downloads, according to the available data) and Abstracts Views on Vision4Press platform.
Data correspond to usage on the plateform after 2015. The current usage metrics is available 48-96 hours after online publication and is updated daily on week days.
Initial download of the metrics may take a while.