Fig. 12.
Download original image
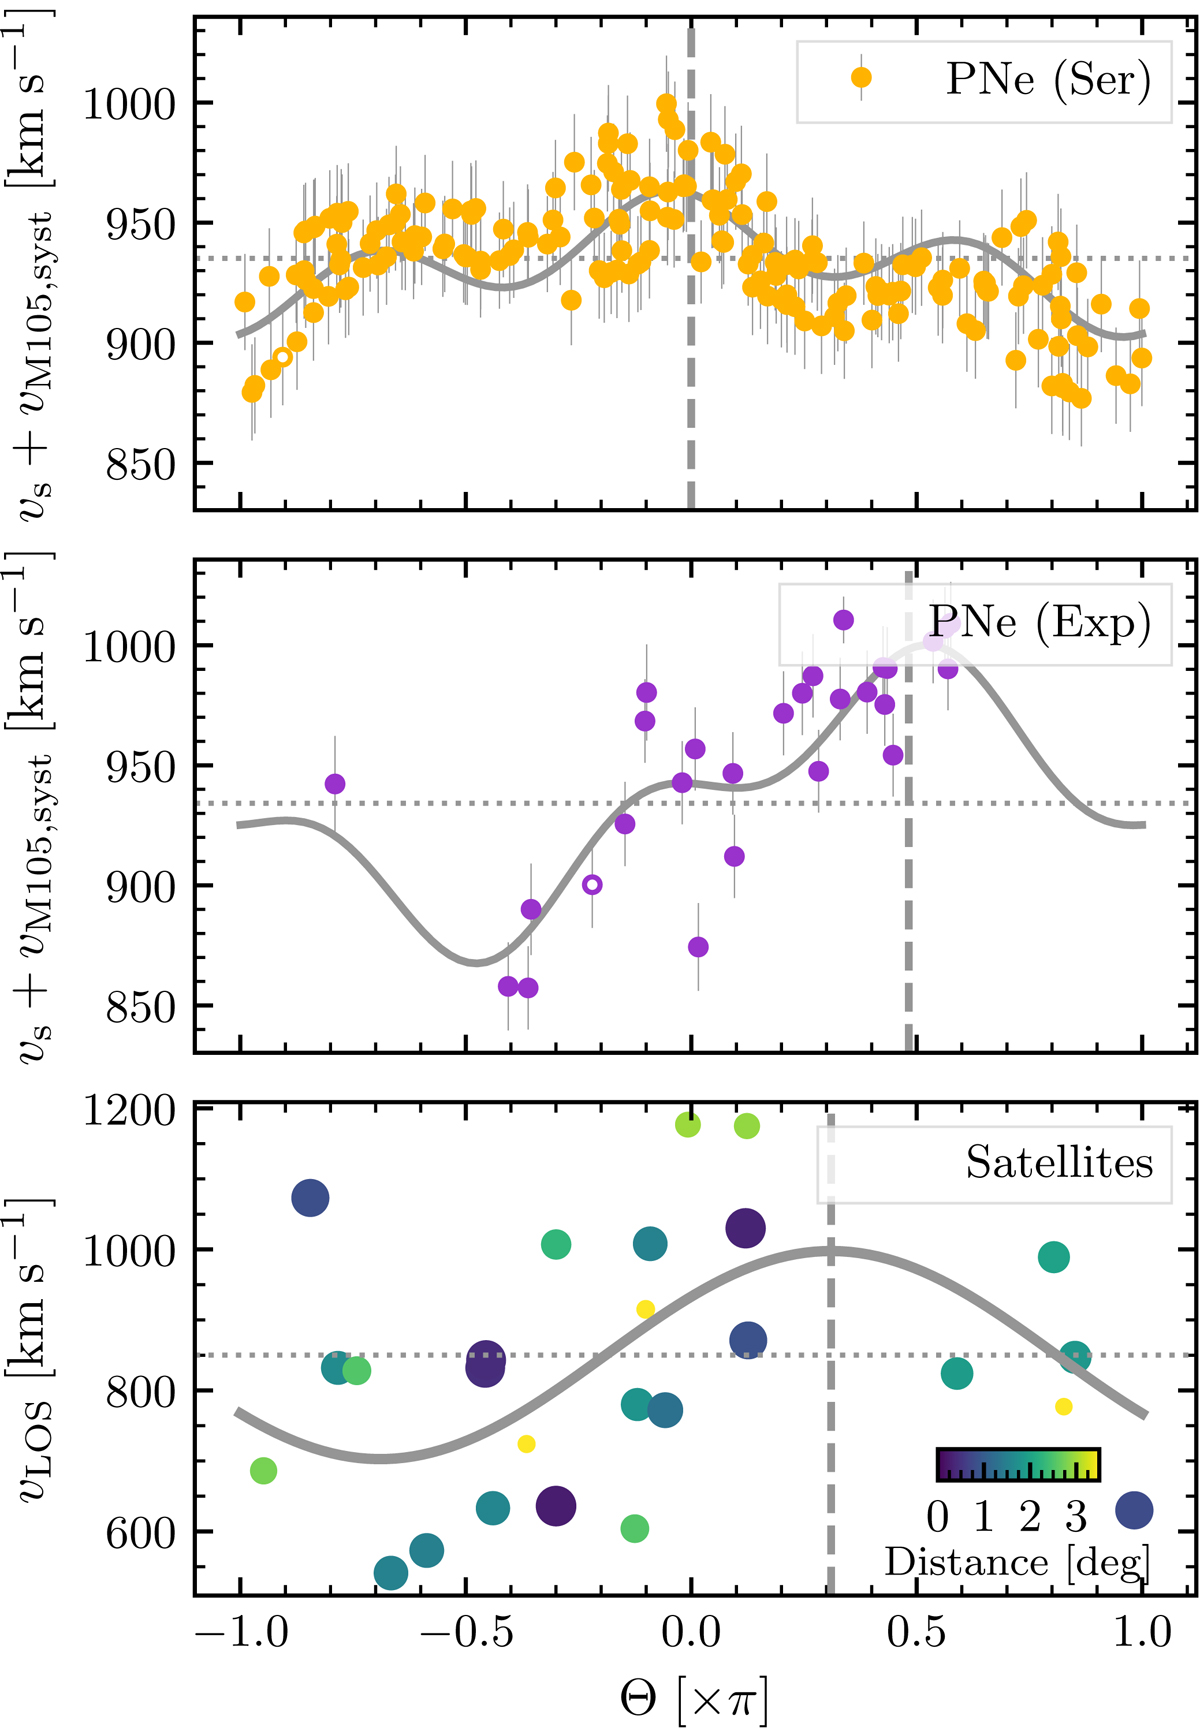
Radially integrated rotation profiles of PNe associated with the Sérsic (top panel) and exponential (middle panel) populations from the kernel-smoothed velocity maps (dots with error bars). The bottom panel shows unsmoothed LOS velocities of satellite galaxies in the Leo I group colour-coded by their on-sky distance to the centre of M 105 (compiled by Müller et al. 2018). In each panel, the best-fit rotation profiles are denoted with solid grey curves, and the corresponding best-fit kinematic position angles (with respect to the photometric one) and systemic velocities are denoted with dashed and dotted grey lines. Open symbols denote PNe excluded from the fit as they lie outside of the 2σ limits determined in Sect. 4.2.
Current usage metrics show cumulative count of Article Views (full-text article views including HTML views, PDF and ePub downloads, according to the available data) and Abstracts Views on Vision4Press platform.
Data correspond to usage on the plateform after 2015. The current usage metrics is available 48-96 hours after online publication and is updated daily on week days.
Initial download of the metrics may take a while.