Fig. 11.
Download original image
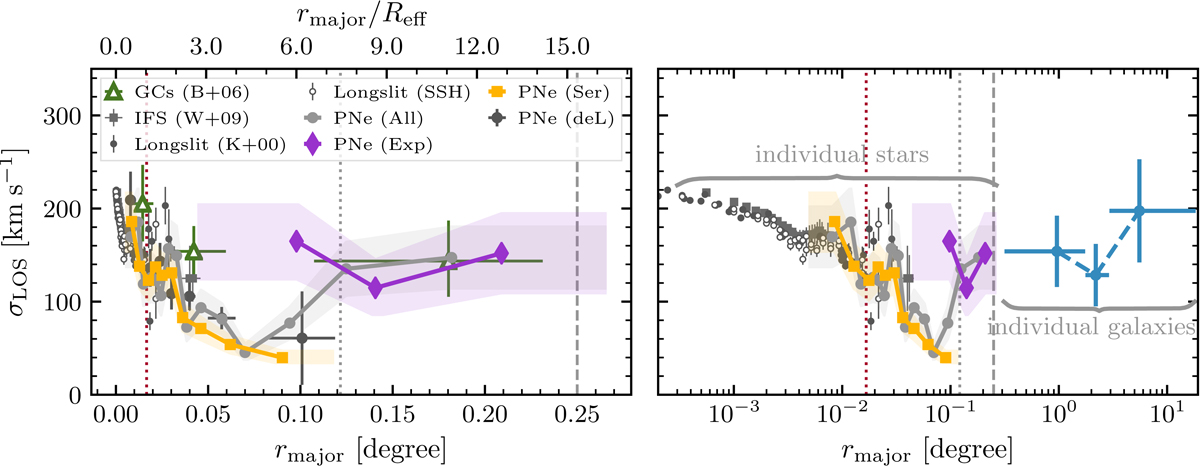
Left: LOS velocity dispersion profiles of M 105 calculated with robust techniques for the total sample of PNe associated with M 105 (solid lines with grey dots), its Sérsic component (solid lines with orange squares), and the exponential envelope (solid lines with purple diamonds). The transparent bands denote the errors on the derived LOS velocity dispersions estimated with robust methods. For comparison, we also show the LOS velocity dispersion used by de Lorenzi et al. (2009, black error bars) from the M 105-C field, and the ones derived from long-slit spectroscopy (Kronawitter et al. (2000, filled black circles with error bars), Statler & Smecker-Hane (1999, open black circles with error bars)) and integral-field spectroscopy (Weijmans et al. 2009, filled grey squares with error bars), as well as the GC velocity dispersion from (Bergond et al. 2006, shown with green triangles with error bars). Right: as in the left panel, but with a logarithmic scale for the major-axis radius. The blue error bars denote the velocity dispersion calculated from the LOS velocities of satellites in the Leo I group (compiled by Müller et al. 2018). In both panels, shaded regions indicate the robust errors. The dotted grey lines denote the radius at which the α-parameter changes, and the grey dashed vertical lines where the exponential SB starts to dominate the total light distribution. The dotted red vertical line denotes the kinematic transition radius determined by Pulsoni et al. (2018).
Current usage metrics show cumulative count of Article Views (full-text article views including HTML views, PDF and ePub downloads, according to the available data) and Abstracts Views on Vision4Press platform.
Data correspond to usage on the plateform after 2015. The current usage metrics is available 48-96 hours after online publication and is updated daily on week days.
Initial download of the metrics may take a while.