Fig. 5
Download original image
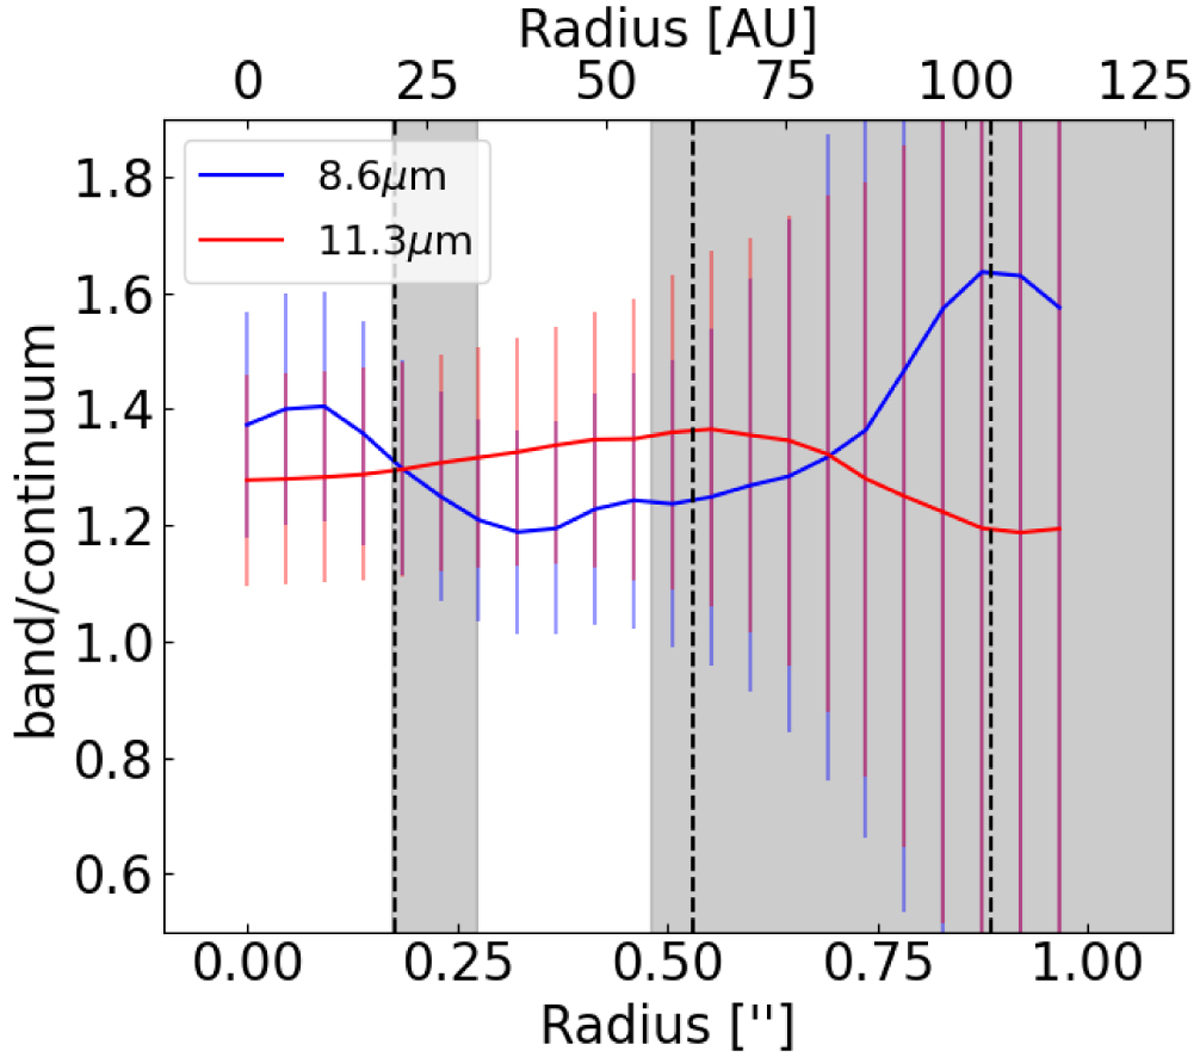
VISIR bands to continuum ratios at 8.6 µm and 11.3 µm. The 8.6 and 11.3 µm band fluxes are azimuthally averaged from the 2D images in the PAH1 and PAH2 VISIR filter (see profiles in Fig. 2), and include the continuum and the pure band emission. The derivation of the pure continuum emission is described in Sect. 3.2. The grey fill indicates the ring and outer disk regions with a continuous distribution of micron-and millimeter-sized grain dust deduced from previous observations (see Fig. 1).
Current usage metrics show cumulative count of Article Views (full-text article views including HTML views, PDF and ePub downloads, according to the available data) and Abstracts Views on Vision4Press platform.
Data correspond to usage on the plateform after 2015. The current usage metrics is available 48-96 hours after online publication and is updated daily on week days.
Initial download of the metrics may take a while.