Fig. 4
Download original image
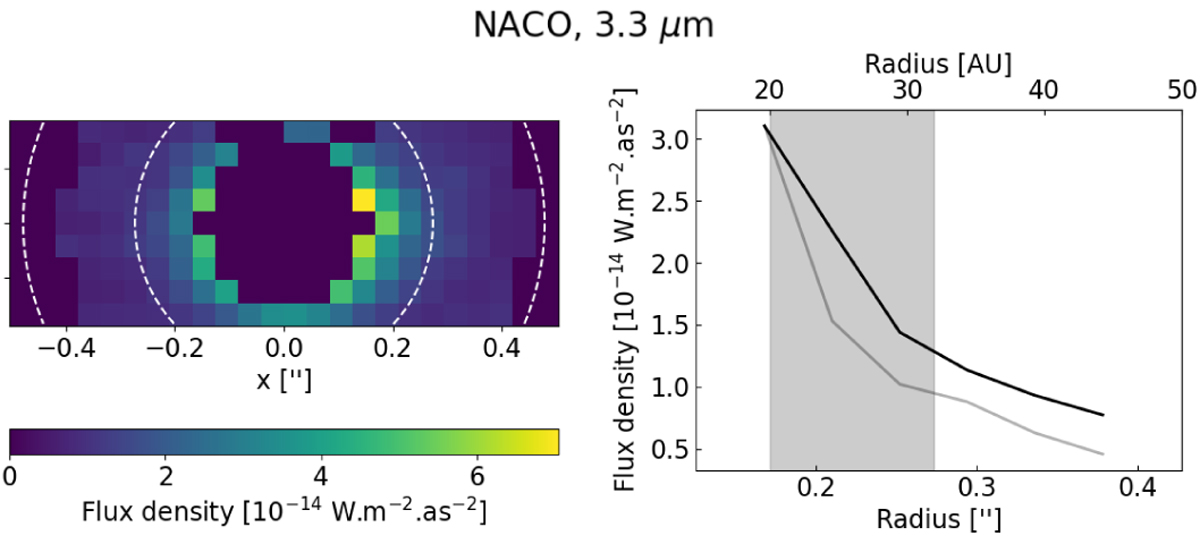
Spatial distribution of the emission of HD 169142 observed with NACO, integrated over the 3.3 µm feature (continuum-subtracted, see details in Sect. 2.3), shown in the upper panel. The inner and outer edge of the gap are shown in with dashed lines. The flux is not computed below 0.168″ and above 0.4″, due to low S/N. The associated azimuthally averaged emission profile is shown in the lower panel. The black solid line is the radial emission profile at 3.3 µm and the grey line is the associated PSF. The grey fill indicates the location of micron- and millimeter-sized grain dust that has been taken from the literature.
Current usage metrics show cumulative count of Article Views (full-text article views including HTML views, PDF and ePub downloads, according to the available data) and Abstracts Views on Vision4Press platform.
Data correspond to usage on the plateform after 2015. The current usage metrics is available 48-96 hours after online publication and is updated daily on week days.
Initial download of the metrics may take a while.