Fig. 3
Download original image
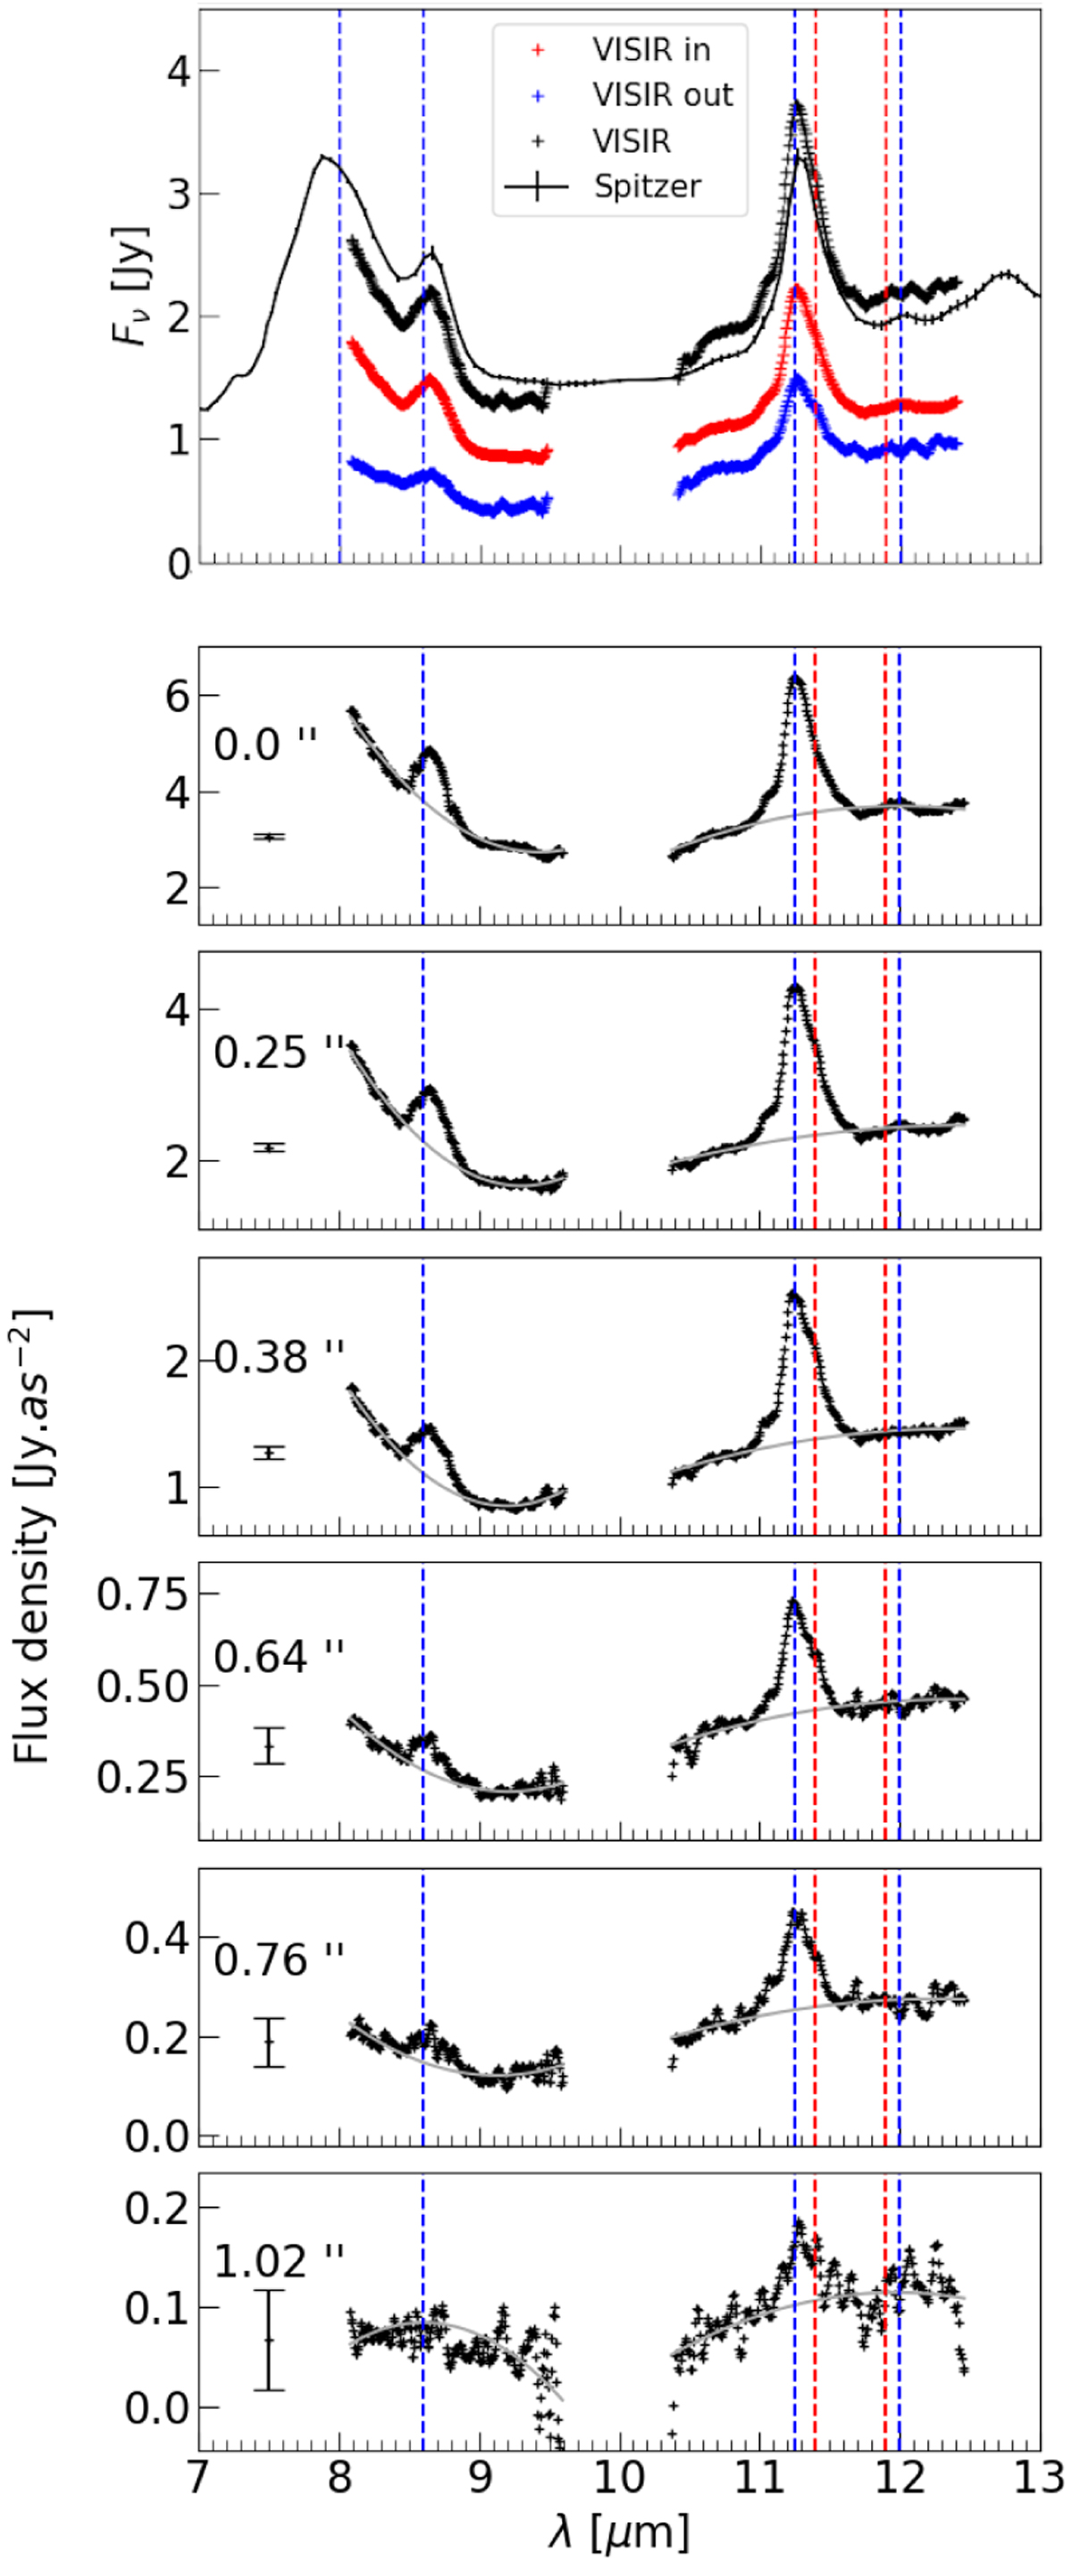
HD 169142 integrated spectra measured by Spitzer (crosses), and spectrum summed from all the VISIR resolved spectra (black line, see bottom panels) are shown in the upper panel. The red curve is the sum of VISIR spatially resolved spectra from 0.0″ to 0.25″, corresponding to the inner 30 AU, and the blue curve is the sum from 0.38″ to 1.02″, corresponding to the outer disk. Correction for the flux outside of the slit is done by weighting each spectrum by the surface of a ring of corresponding radius, and width, 0.127″. Panels 2–7 show the surface brightness is measured on spatially resolved slit spectra at radii of 0″, 0.25″, … The spectra are not continuum subtracted. They probe ring-like regions of a width 0.128″ (1 pixel) and mean radii of 0″, 0.25″, … in the disk. The spectral region without data delimits the telluric ozone absorption region. The over-plotted vertical lines show the positions of the aromatic (blue) and crystalline forsterite (red) main features. The typical ±3σ error derived from background noise (50 mJy as−2) is shown in every panel. The grey full line shows the continuum interpolation under each band by a 2-degree polynomial.
Current usage metrics show cumulative count of Article Views (full-text article views including HTML views, PDF and ePub downloads, according to the available data) and Abstracts Views on Vision4Press platform.
Data correspond to usage on the plateform after 2015. The current usage metrics is available 48-96 hours after online publication and is updated daily on week days.
Initial download of the metrics may take a while.