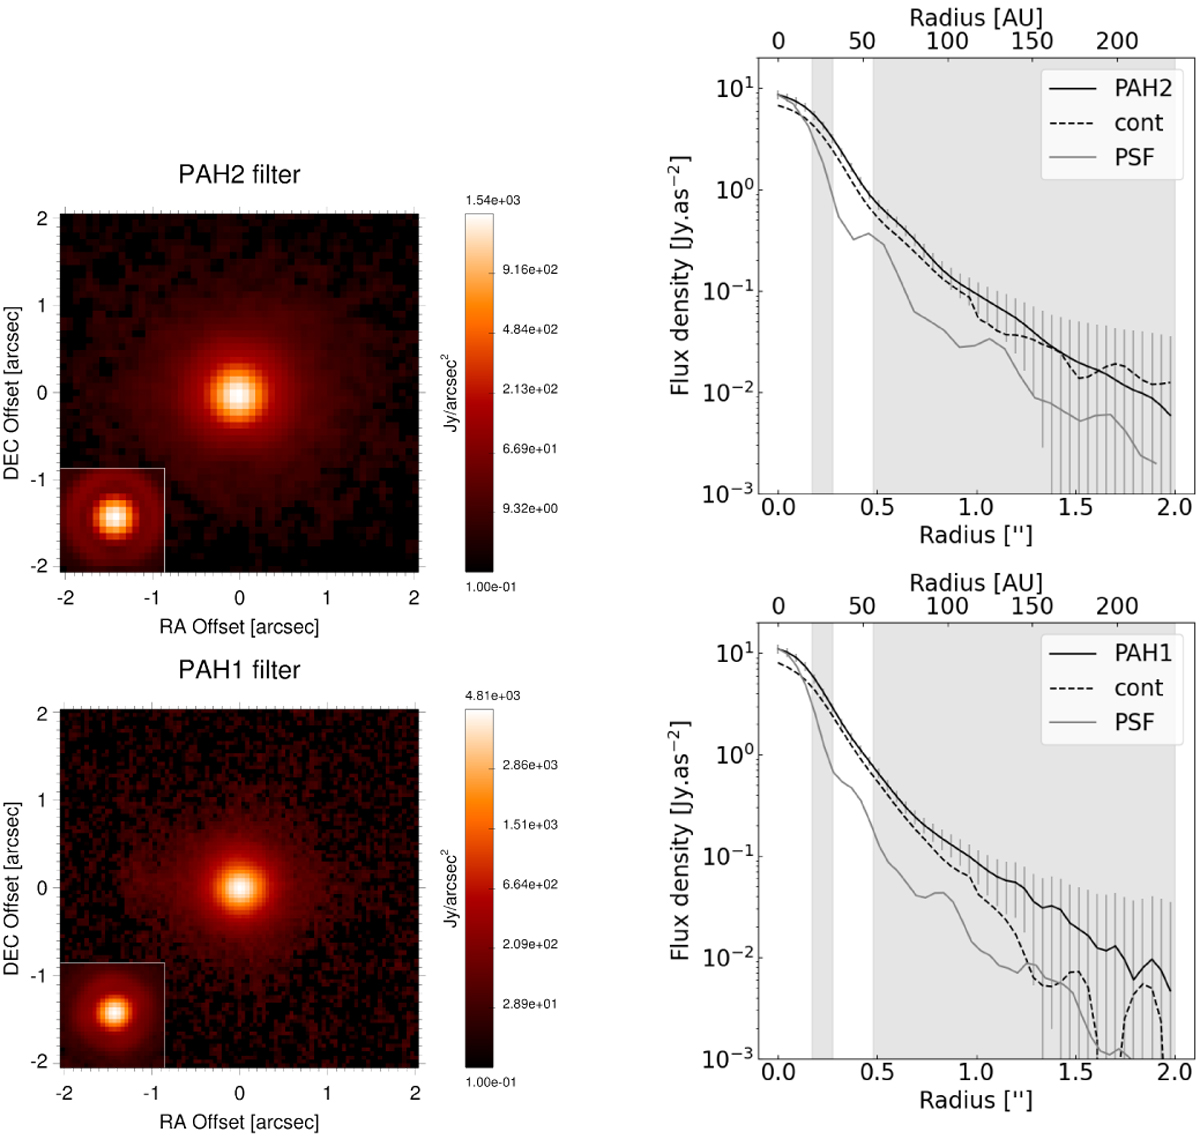
Fig. 2
Download original image
Total emission map (band + continuum) in the 11.3 µm PAH2 and 8.6 µm PAH1 VISIR filter, compared to the PSF of the observation in the same filters in the inset (left panel). The PAH1 and PAH2 emission in HD 169142 are spatially more extended than the filter PSF and show no Airy ring, which is also indicative of a spatially resolved emission. Azimuthally averaged emission profiles (centered on the brightest pixel) in the PAH1 and PAH2 VISIR filter, compared to the underlying continuum emission, shown as dashed lines (computed as described in Sect. 3.2), and the associated PSF profiles, shown as thin lines (right panel). The error bars on the profiles, taking into account the absolute calibration error, are shown in grey. The location of micron- and millimeter-sized grain dust, taken from the literature (see Fig. 1), are indicated by the grey fill.
Current usage metrics show cumulative count of Article Views (full-text article views including HTML views, PDF and ePub downloads, according to the available data) and Abstracts Views on Vision4Press platform.
Data correspond to usage on the plateform after 2015. The current usage metrics is available 48-96 hours after online publication and is updated daily on week days.
Initial download of the metrics may take a while.