Fig. B.2
Download original image
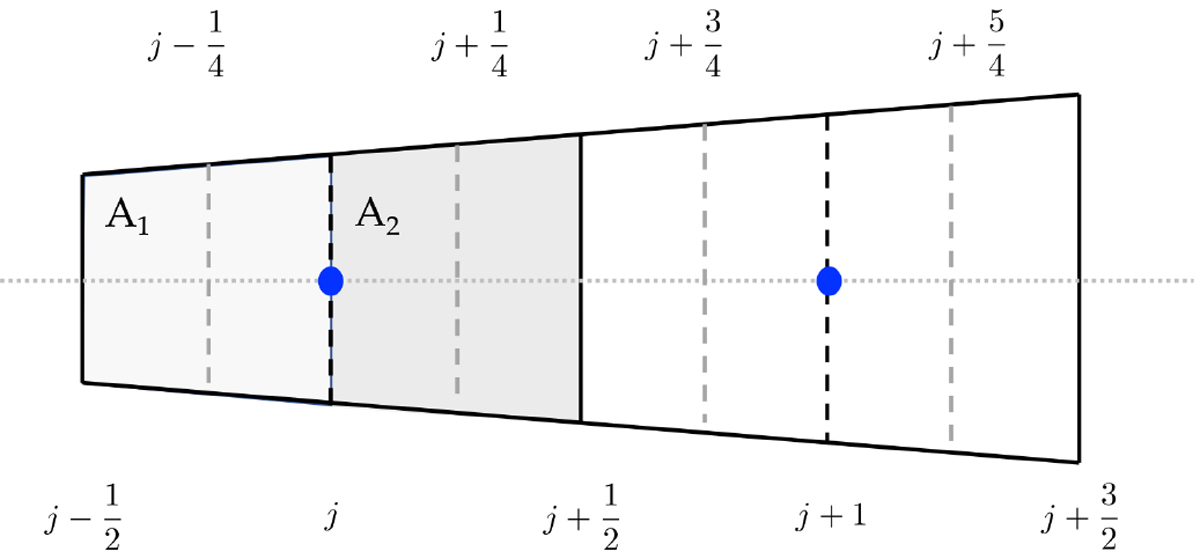
Subdivision of a surface area into two subsurface areas, A1 and A2 (light grey and grey regions). The big blue dots indicate the centres of horizontal intervals. The areas are calculated analytically by taking their dependence on colatitude into account. The configuration of the diagram corresponds to small horizontal intervals, where this dependence is approximately linear.
Current usage metrics show cumulative count of Article Views (full-text article views including HTML views, PDF and ePub downloads, according to the available data) and Abstracts Views on Vision4Press platform.
Data correspond to usage on the plateform after 2015. The current usage metrics is available 48-96 hours after online publication and is updated daily on week days.
Initial download of the metrics may take a while.