Fig. 6
Download original image
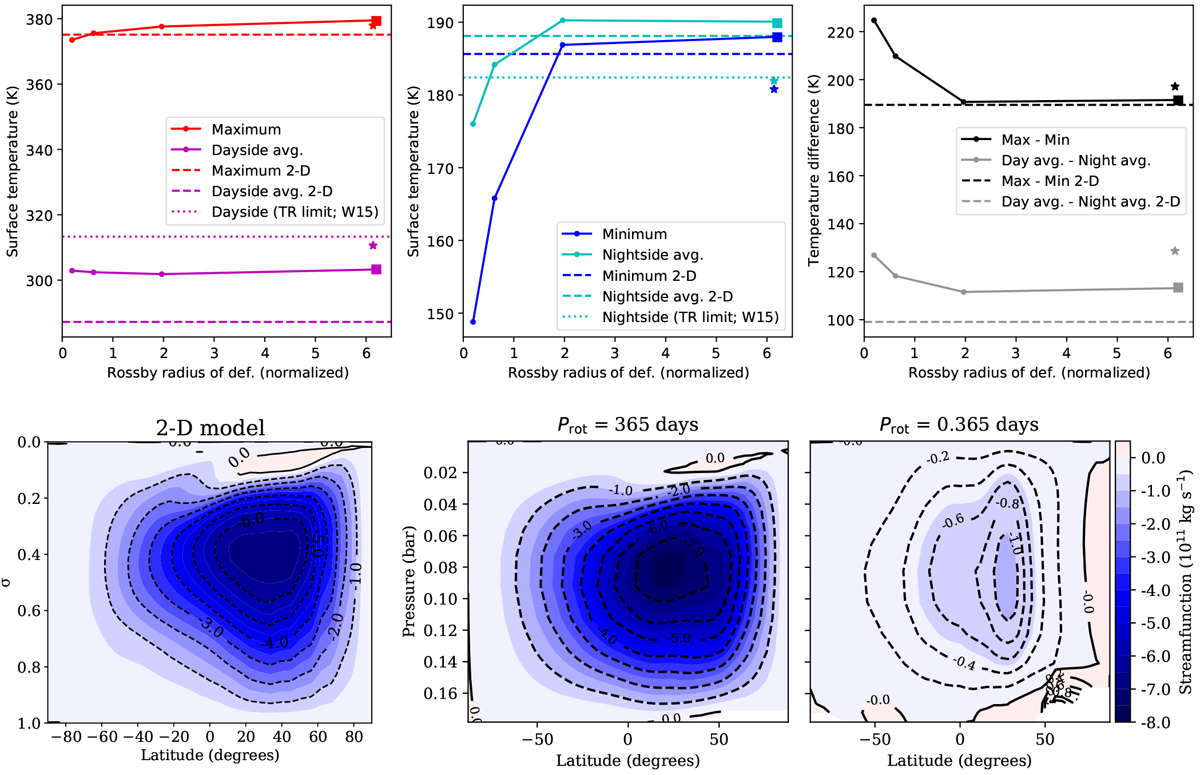
Dayside and nightside surface temperatures vs. normalised equatorial Rossby deformation radius ![]() in the grey 3D GCM simulations performed with THOR. Top left: maximum (solid red line) and hemisphere-averaged (solid purple line) dayside surface temperatures. Top middle: minimum (solid blue line) and hemisphere-averaged (solid green line) nightside surface temperature. Top right: day night averaged (solid grey line) and extremal (solid black line) surface temperature differences. Dashed lines, dotted lines, star symbols, and square points indicate (i) the asymptotic surface temperatures computed using the 2D model, (ii) the hemisphere-averaged surface temperatures predicted by Wordsworth’s greenhouse model (W15; Wordsworth 2015), (iii) the surface temperatures obtained in the 3D simulation without turbulent diffusion in the slow rotator case, and (iv) those obtained in the simulation performed with the same asymptotic scale lengths in the PBL as in the GCMM, respectively. Bottom, from left to right: averaged snapshots of the Eulerian mean stream function (e.g. Pauluis et al. 2008) obtained from the 2D simulation (zero-spin rate limit), the 3D simulation for Ρ = 365 days (slow rotator), and the 3D simulation for Ρ = 0.365 days (fast rotator).
in the grey 3D GCM simulations performed with THOR. Top left: maximum (solid red line) and hemisphere-averaged (solid purple line) dayside surface temperatures. Top middle: minimum (solid blue line) and hemisphere-averaged (solid green line) nightside surface temperature. Top right: day night averaged (solid grey line) and extremal (solid black line) surface temperature differences. Dashed lines, dotted lines, star symbols, and square points indicate (i) the asymptotic surface temperatures computed using the 2D model, (ii) the hemisphere-averaged surface temperatures predicted by Wordsworth’s greenhouse model (W15; Wordsworth 2015), (iii) the surface temperatures obtained in the 3D simulation without turbulent diffusion in the slow rotator case, and (iv) those obtained in the simulation performed with the same asymptotic scale lengths in the PBL as in the GCMM, respectively. Bottom, from left to right: averaged snapshots of the Eulerian mean stream function (e.g. Pauluis et al. 2008) obtained from the 2D simulation (zero-spin rate limit), the 3D simulation for Ρ = 365 days (slow rotator), and the 3D simulation for Ρ = 0.365 days (fast rotator).
Current usage metrics show cumulative count of Article Views (full-text article views including HTML views, PDF and ePub downloads, according to the available data) and Abstracts Views on Vision4Press platform.
Data correspond to usage on the plateform after 2015. The current usage metrics is available 48-96 hours after online publication and is updated daily on week days.
Initial download of the metrics may take a while.