Fig. 3
Download original image
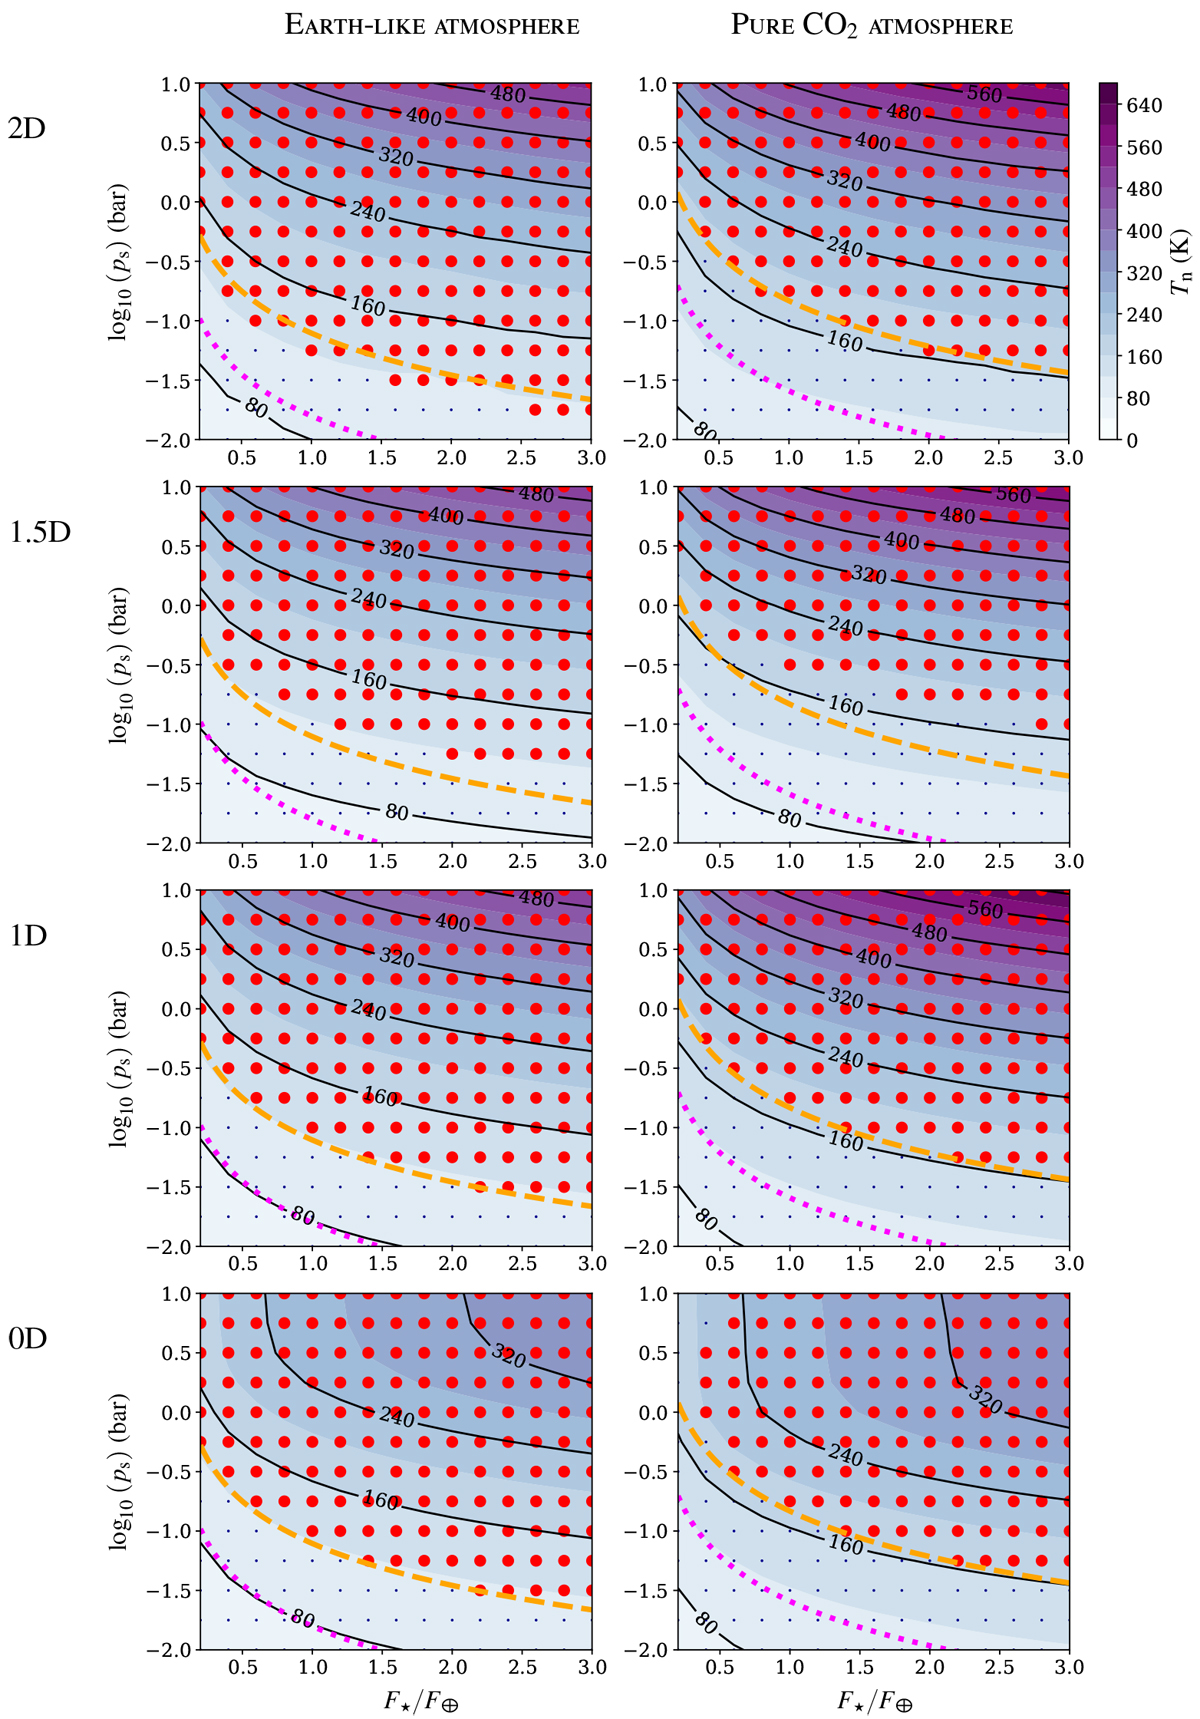
Stability diagrams of Earth-sized tidally locked planets with Earth-like (left panels) and pure CO2 (right panels) atmospheres, and the associated minimum surface temperature. Quantities are plotted as functions of the stellar flux normalised by the Earth’s stellar flux, F⋆/F⊕ (horizontal axis), and the surface pressure, ps, in logarithmic scale (vertical axis). From bottom to top: 0D (1 × 1 grid), 1D (1 × 50 grid), 1.5D (2 × 50 grid), and 2D (32 × 50 grid) instances of the meta-model. Large red dots indicate simulations where the atmosphere remained stable, while small blue dots indicate atmospheric collapse. The dashed orange (or dotted pink) line indicates the collapse pressure pC;low (or pC;up) corresponding to the lower (or upper) bound of the nightside surface temperature predicted by Wordsworth’s analytic model and given by Eq. (11).
Current usage metrics show cumulative count of Article Views (full-text article views including HTML views, PDF and ePub downloads, according to the available data) and Abstracts Views on Vision4Press platform.
Data correspond to usage on the plateform after 2015. The current usage metrics is available 48-96 hours after online publication and is updated daily on week days.
Initial download of the metrics may take a while.