Open Access
Fig. 8
Download original image
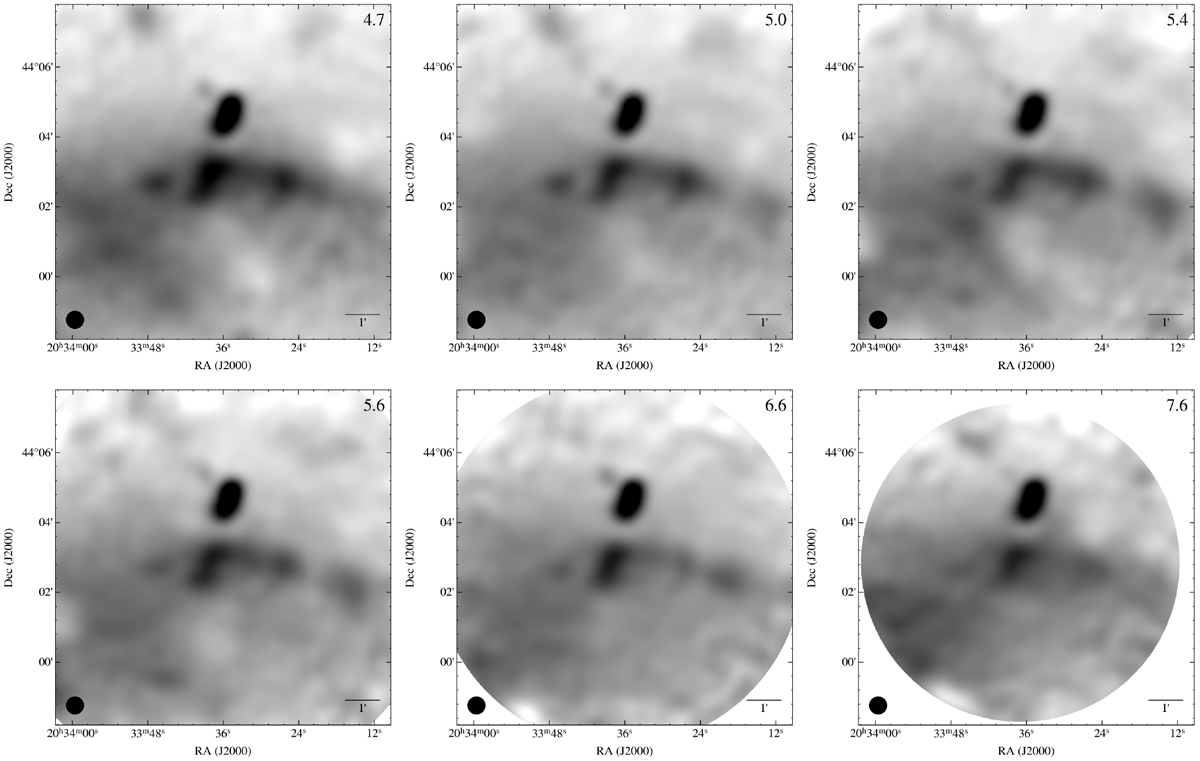
Feathered results for BSBD43. All images appear within the limits of [0,1.2] MJy sr−1. The central frequency of each image is given at the top-right corner in GHz.
Current usage metrics show cumulative count of Article Views (full-text article views including HTML views, PDF and ePub downloads, according to the available data) and Abstracts Views on Vision4Press platform.
Data correspond to usage on the plateform after 2015. The current usage metrics is available 48-96 hours after online publication and is updated daily on week days.
Initial download of the metrics may take a while.