Fig. 6
Download original image
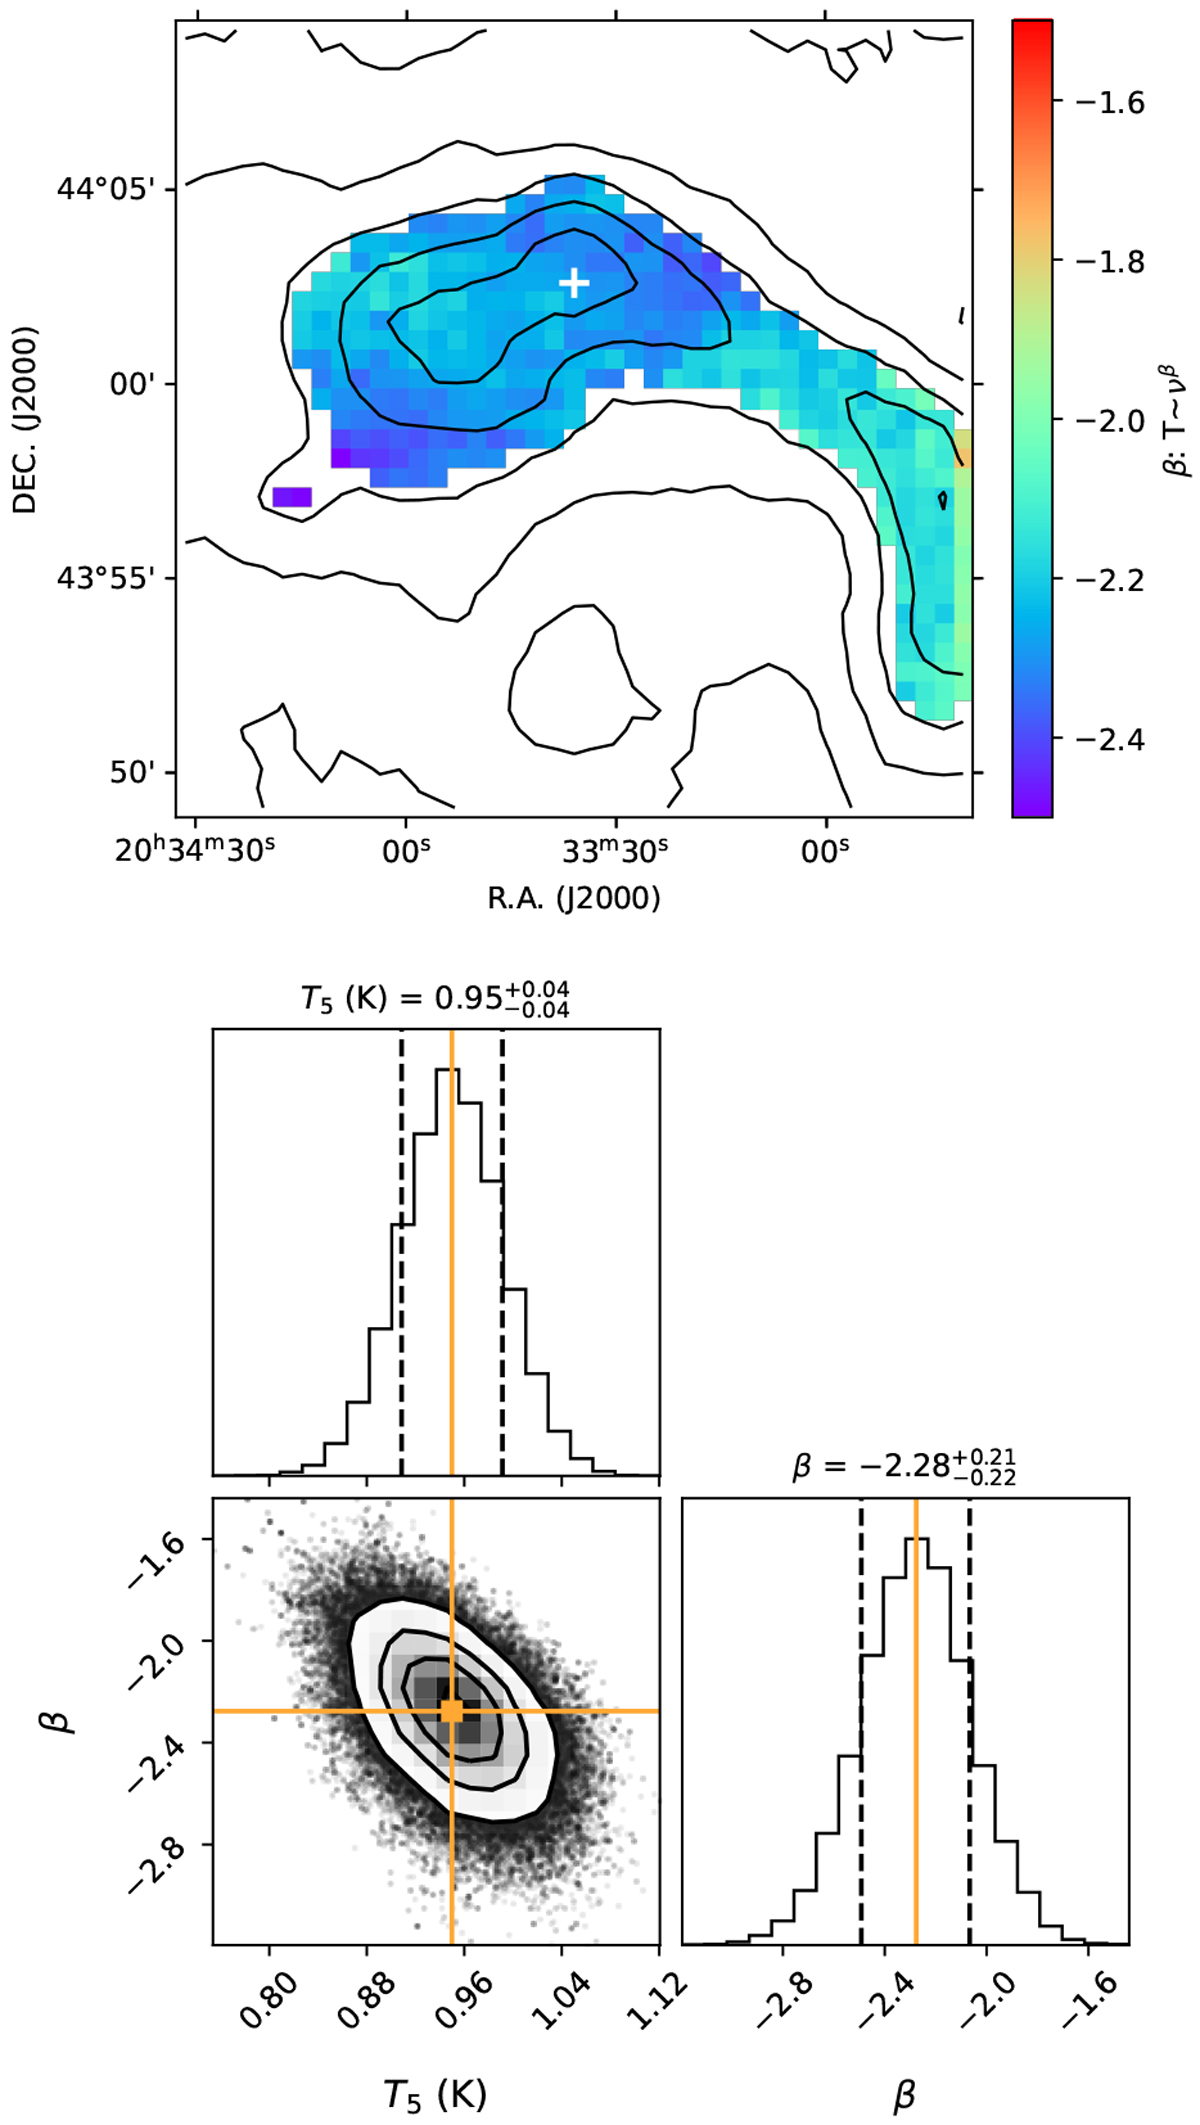
Single-dish data analysis. Top: spectral index map of the bow shock of BD+43°3654, as seen with the Effelsberg telescope. As can be seen, the data are dominated by free-free emission. Bottom: posterior probability distributions of the fitted TB and β towards the position indicated by the cross in the middle panel. The maximum posterior possibility point in the parameter space is shown as an orange line. Contours denote the 0.5, 1.0, 1.5, and 2.0σ confidence intervals.
Current usage metrics show cumulative count of Article Views (full-text article views including HTML views, PDF and ePub downloads, according to the available data) and Abstracts Views on Vision4Press platform.
Data correspond to usage on the plateform after 2015. The current usage metrics is available 48-96 hours after online publication and is updated daily on week days.
Initial download of the metrics may take a while.