Fig. 3
Download original image
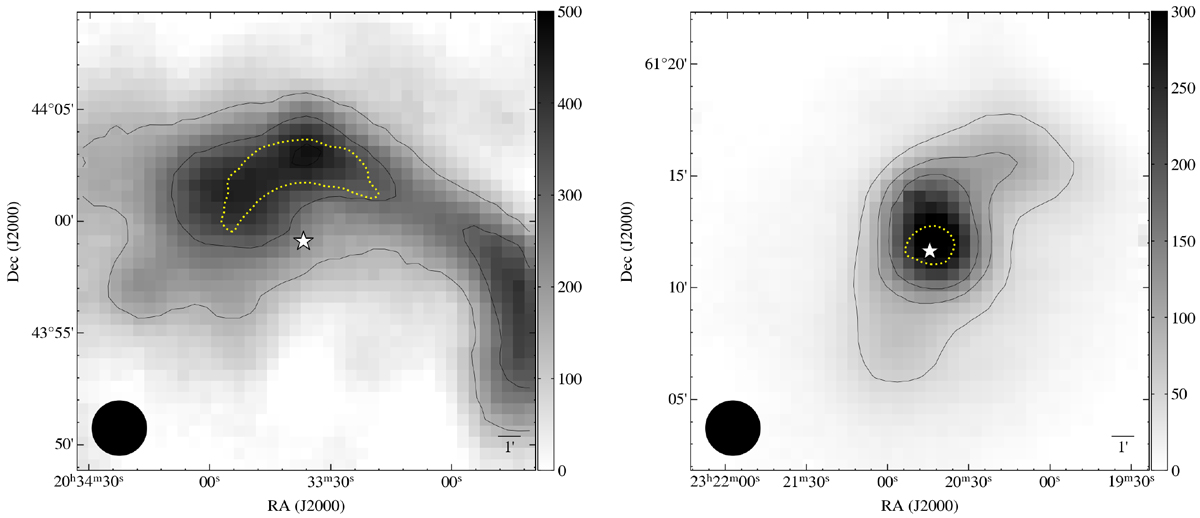
Intensity map of the Effelsberg data at 4.5 GHz for BSBD43 (left) and BSBD60 (right). The beam size is represented as a solid black disc at the bottom left, while the star is represented with a white asterisk. The grey scale shows the intensity in mJy beam−1. The contours represent emission of 5, 10, and 15 σ, where σ is 30 mJy beam−1 and 10 mJy beam−1 for BSBD43 and BSBD60, respectively. The dotted yellow contours represent WISE emission at 22 μm, of 250 dn and 580 dn.
Current usage metrics show cumulative count of Article Views (full-text article views including HTML views, PDF and ePub downloads, according to the available data) and Abstracts Views on Vision4Press platform.
Data correspond to usage on the plateform after 2015. The current usage metrics is available 48-96 hours after online publication and is updated daily on week days.
Initial download of the metrics may take a while.